NVR stock forecast 2027–2029
MyStockButler's October 2026 analysis: NVR’s weighted price path falls to US$4,429.77 in October 2027 before recovering above today’s price at US$6,974.53 in October 2029. It hinges on margin stabilization and profitable backlog conversion.
Where could NVR’s shares go?
The bear case receives 40% and the base case 45%. The bull case receives 15%. The weighted price is $4,429.77 in October 2027, a 27% loss including dividends. It is $5,376.73 in October 2028, a 12% loss. It reaches $6,974.53 in October 2029, a 15% gain. The 2029 range begins at $3,045.97. It ends at $12,987.33, against today’s $6,080.17.
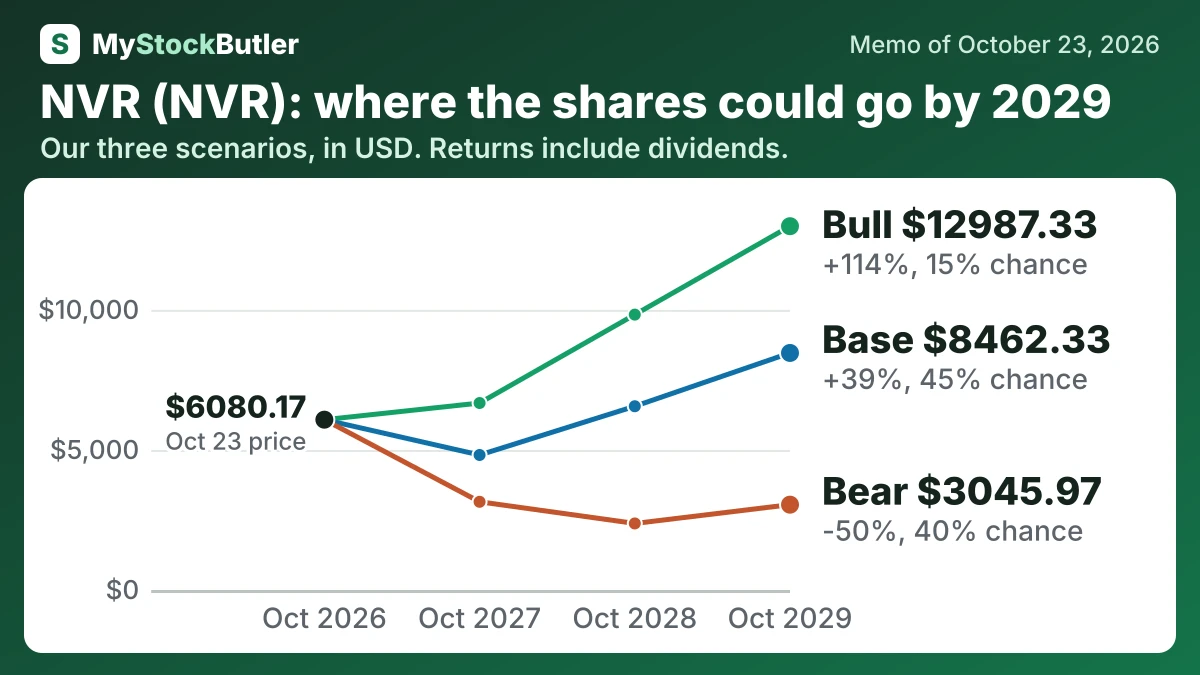
| Case | Probability | October 2027 | October 2028 | October 2029 |
|---|---|---|---|---|
| Bear | 40% | 3149.13 (-48%) | 2375.76 (-61%) | 3045.97 (-50%) |
| Base | 45% | 4819.70 (-21%) | 6559.64 (+8%) | 8462.33 (+39%) |
| Bull | 15% | 6675.02 (+10%) | 9830.60 (+62%) | 12987.33 (+114%) |
| Weighted | 100% | 4429.77 (-27%) | 5376.73 (-12%) | 6974.53 (+15%) |
What this means. The weighted row is the average value after giving each case its probability; it is not a separate likely outcome.
What has to go right or wrong for NVR?
Base normal operating profit is $1,350 million in October 2027. It rises to $1,650 million in 2028 and $1,900 million in 2029. The near-term figure is anchored by the supplied $352.49 next-twelve-month EPS estimate, while the recovery reflects NVR’s five-year operating-profit average near $2 billion. The bear case gives $1,056 million, then $900 million, because affordability, cancellations and concessions remain severe. The bull case gives $1,650 million, then $2,050 million and $2,300 million, because stronger absorption restores pricing and margins.
How much cash does NVR really make?
The five-year record shows a range rather than a fixed cash yield. Free cash flow was strongest when working capital released cash and weaker when NVR built its pipeline. Subtracting stock-based compensation produces “real free cash flow,” an economic measure of the cost borne by shareholders rather than a second cash deduction.
| 2025 | 2024 | 2023 | 2022 | 2021 | |
|---|---|---|---|---|---|
| Cash from operations | 1,121,320 | 1,374,462 | 1,497,993 | 1,870,101 | 1,242,393 |
| − Capital spending | 24,508 | 29,212 | 24,877 | 18,428 | 17,875 |
| = Free cash flow | 1,096,812 | 1,345,250 | 1,473,116 | 1,851,673 | 1,224,518 |
| − Stock pay | 69,213 | 73,925 | 99,507 | 82,537 | 58,234 |
| = Real free cash flow | 1,027,599 | 1,271,325 | 1,373,609 | 1,769,136 | 1,166,284 |
| Real free cash flow, % of revenue | 10.0% | 12.1% | 14.4% | 16.8% | 13.0% |
What this means. Real free cash flow is lower because shares given to employees cost no cash today but reduce existing shareholders’ ownership.
What does an investor pay for NVR today?
A share price matters only beside the profit attached to one share. P/E makes that comparison by dividing price by earnings, while forward P/E uses an estimate of the next twelve months. At 17.2x forward earnings, the share price implies about $353.50 of future earnings per share. That estimate depends on earnings slowing their decline, so repeatability matters more than whether the ratio looks modest.
| Today (Oct 23, 2026) | |
|---|---|
| Share price | 6,080.17 |
| P/E, next 12 months (calculated) | 17.2x |
| Price to book (calculated) | 4.7x |
| Free cash flow yield (calculated) | 6.8% |
| Real free cash flow yield (calculated) | 6.4% |
What this means. The free cash flow yields include the Mortgage Banking business, so they measure cash from the whole company, not just homebuilding.