Newmont stock forecast 2027–2029
MyStockButler's October 2026 analysis: Newmont’s weighted forecast points to US$138.87 by October 2029, with the base case at 54%, the bear case at 28%, and the bull case at 18%. Newmont’s outcome hinges on sustained cash generation, project delivery and costs.
Where could Newmont’s shares be by October 2029?
The weighted forecast is positive, but it hides a very wide distribution of outcomes. October 2027 reaches $130.72, a 15% total return from today. October 2028 reaches $139.41, a 24% return. October 2029 reaches $138.87, also a 24% return.
By October 2029, the bear case gives $34.47, while the bull case gives $286.82. Today’s reference price is $114.11. The base case has the highest probability at 54%. The bear case receives 28%. The bull case receives 18%.
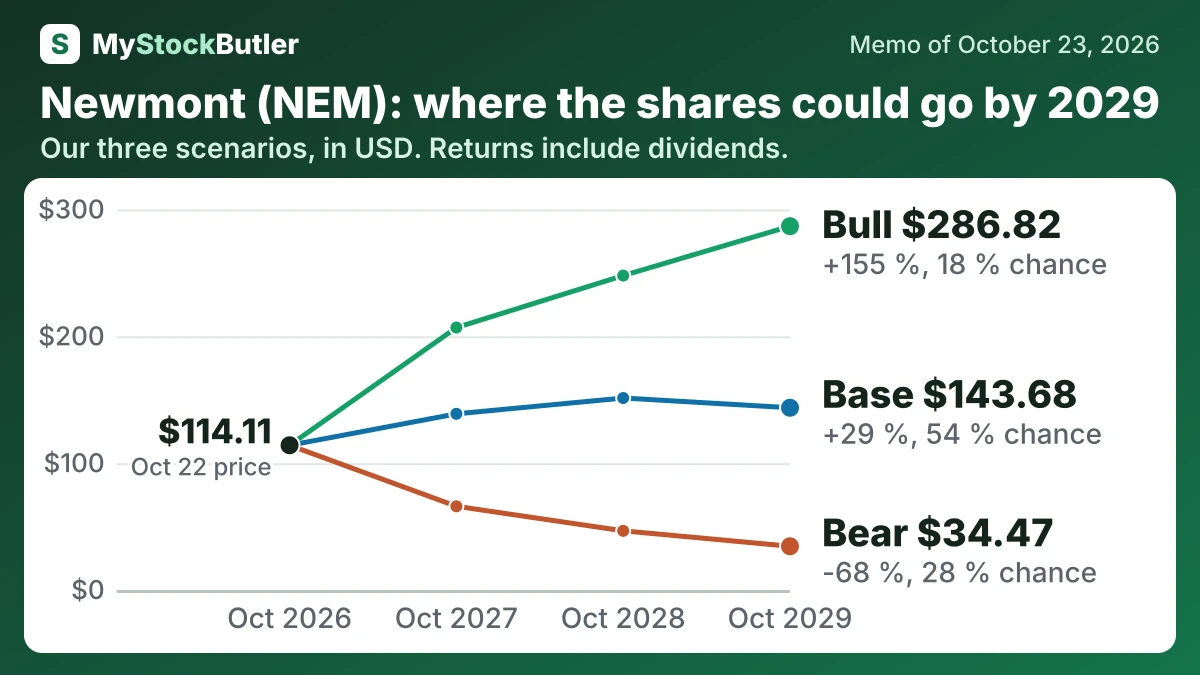
| Case | Probability | October 2027 | October 2028 | October 2029 |
|---|---|---|---|---|
| Bear | 28 % | 65.98 (-41 %) | 46.63 (-58 %) | 34.47 (-68 %) |
| Base | 54 % | 138.90 (+23 %) | 151.35 (+34 %) | 143.68 (+29 %) |
| Bull | 18 % | 206.90 (+82 %) | 247.89 (+119 %) | 286.82 (+155 %) |
| Weighted | 100 % | 130.72 (+15 %) | 139.41 (+24 %) | 138.87 (+24 %) |
What this means. The weighted row is the probability-based average of the three cases, not a separate prediction that is guaranteed to happen.
What has to go right or wrong for Newmont?
EBITDA is the central operating assumption. The base case rises into 2028, then moderates, reflecting elevated gold prices, roughly guided production and higher costs. The bear case declines each year as prices weaken, volumes fall and costs inflate. The bull case rises each year as gold remains strong, production grows and costs stay controlled.
| October 2027 | October 2028 | October 2029 | |
|---|---|---|---|
| EBITDA | 18,025 (11,900 / 22,365) | 18,670 (9,000 / 24,190) | 17,888 (7,365 / 25,505) |
| Shares (millions) | 1,021 (1,033 / 1,010) | 1,009 (1,029 / 991) | 1,001 (1,026 / 975) |
| Dividends per share | 1.04 (0.80 / 1.20) | 1.04 (0.60 / 1.36) | 1.04 (0.40 / 1.52) |
| Enterprise value to ebitda | 7.50 (5.50 / 9.00) | 7.50 (5.00 / 9.50) | 7.00 (4.50 / 10.00) |
| Net debt | -6,633 (-2,711 / -7,681) | -12,692 (-2,979 / -15,852) | -18,614 (-2,227 / -24,597) |
What this means. A negative net debt means the company has more cash than borrowed money.
How much cash does Newmont really make?
Newmont reports free cash flow of US$7.3 billion. After lease payments and stock-based pay, real free cash flow falls to US$7.1 billion. Stock-based pay uses no immediate cash, but it gives employees ownership claims, so existing shareholders bear an economic cost.
| 2025 | 2024 | 2023 | 2022 | 2021 | |
|---|---|---|---|---|---|
| Cash from operations | 10,334 | 6,318 | 2,754 | 3,198 | 4,266 |
| − Capital spending | 3,035 | 3,402 | 2,666 | 2,131 | 1,653 |
| = Free cash flow | 7,204 | 2,829 | 21 | 1,001 | 2,540 |
| − Stock pay | 99 | 89 | 80 | 73 | 72 |
| = Real free cash flow | 7,105 | 2,740 | -59 | 928 | 2,468 |
What this means. The company's own free cash flow is higher because it adds back lease payments, even though that cash has left the company.
What does an investor pay for Newmont today?
The P/E looks reasonable because current earnings are unusually strong. Newmont received US$4,317 an ounce in the third quarter of 2026, while by-product AISC was US$1,454 an ounce. AISC estimates the cost of sustaining production, not final profit. Taxes, financing, development spending and corporate costs still come afterward. By-product accounting also lets copper and silver revenue reduce the cost assigned to gold.