Newmont dividend: cash coverage and yield
MyStockButler's October 2026 analysis: Newmont pays $1.04 per share annually, matching the current $0.26 quarterly rate. In 2025, Newmont generated US$7.2 billion of free cash flow, paid US$1.1 billion in dividends and repurchased US$2.3 billion of shares, leaving US$2.7 billion of net cash.
How much does Newmont pay in dividends?
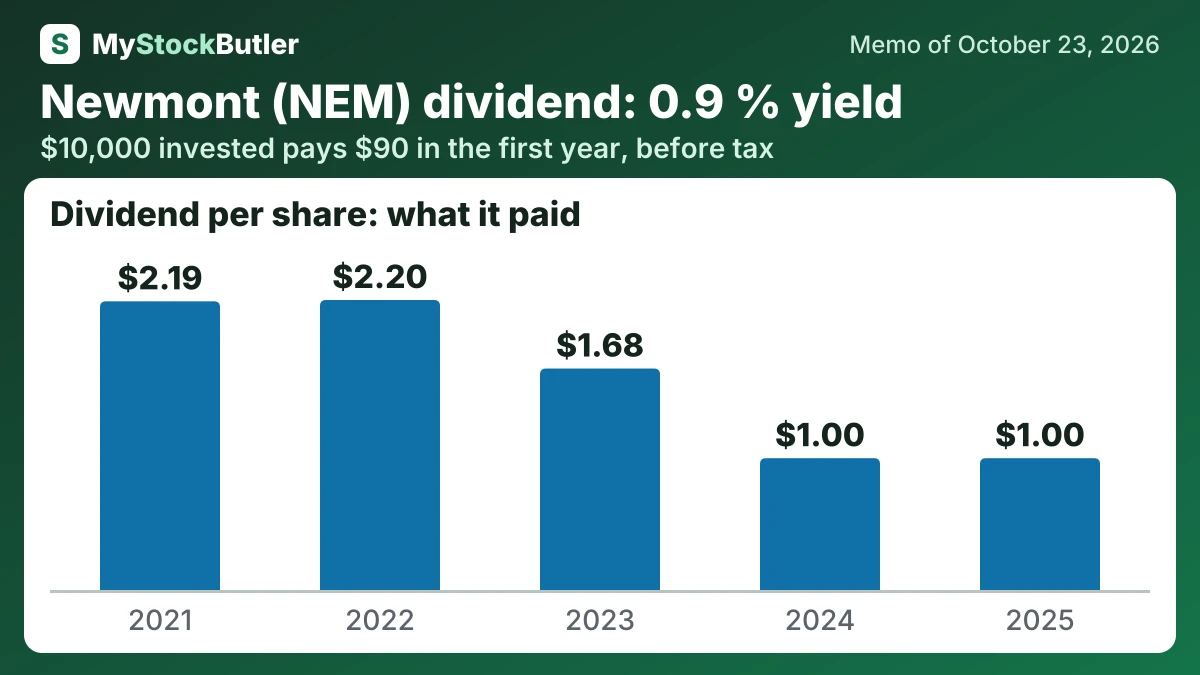
Dividends remain $1.04 per share annually in the base case, matching the current $0.26 quarterly rate. The bear case cuts the payout each year because the board retains discretion and the historical annual dividend fell from $2.20 in 2021 to $1.01 in 2025. The bull case raises it gradually, but no dividend-growth target supports treating that outcome as central.
| 2025 | 2024 | 2023 | 2022 | 2021 | |
|---|---|---|---|---|---|
| Real free cash flow per share | 6.41 | 2.39 | -0.07 | 1.17 | 3.08 |
| − Dividends paid, per share | 1.00 | 1.00 | 1.68 | 2.20 | 2.19 |
| − Share buybacks, per share | 2.08 | 1.09 | 0.00 | 0.00 | 0.66 |
| = FCF not paid out, per share | 3.23 | 0.24 | 0.07 | ||
| = Paid out more than FCF, per share | 1.84 | 1.18 |
What this means. The company's own free cash flow per share is higher because it does not subtract shares given to employees as pay; we subtract them to show what each existing share really gets.
How much would Newmont's dividend pay you?
$10,000 invested in Newmont at its 0.9% dividend yield (our report of October 23, 2026) pays $90.00 in the first year, before tax. If its dividend per share keeps changing −17.8% a year, as it did from 2021 to 2025, and the dividends are reinvested, year 10 pays $16.08, with $442.76 received in all.
Before tax. Past dividend growth is not a promise. Information only, not investment advice.
Is Newmont's dividend covered by its cash?
By 2025, Newmont generated US$7.2 billion of free cash flow, paid US$1.1 billion in dividends and repurchased US$2.3 billion of shares. It also repaid US$3.4 billion of debt. Asset sales and investments supplied additional cash, leaving US$8.2 billion of cash and short-term investments against US$5.6 billion of debt, or net cash of US$2.7 billion.
| 2025 | 2024 | 2023 | 2022 | 2021 | |
|---|---|---|---|---|---|
| Free cash flow | 7,204 | 2,829 | 21 | 1,001 | 2,540 |
| − Dividends paid | 1,106 | 1,145 | 1,415 | 1,746 | 1,757 |
| − Share buybacks | 2,303 | 1,246 | 0 | 0 | 525 |
| = Free cash flow not paid out | 3,578 | 277 | 58 | ||
| = Paid out more than the free cash flow | 1,544 | 936 | |||
| = Net cash | 2,652 |
What this means. In 2023, the company paid shareholders far more than the small amount of free cash it made, so the payout percentage is unusually high.
What could change Newmont's dividend?
The view would move toward the bear case if Q4 2026 confirms AISC near the top of the $1,805–1,995 range, or if 2027 production misses guidance. Construction delays, higher development spending or weaker gold prices through 2027–2029 would further reduce EBITDA, cash flow and buybacks.
The base case would gain support if Ahafo North and Tanami deliver their expected production growth on schedule. It would also require capital spending to remain close to plan while the $0.26 quarterly dividend continues.
What is Newmont's dividend yield today?
Free cash flow is closer to shareholder cash. The 6.1% yield implies about US$7.2 billion against today’s equity value. An 8% yield at the same price would require about US$9.5 billion. If free cash flow fell by one-third, the yield would fall to about 4.1%.
| Today (Oct 23, 2026) | |
|---|---|
| Share price | 114.11 |
| Free cash flow yield (calculated) | 6.1% |
| Real free cash flow yield (calculated) | 6.0% |
| Dividend yield (calculated) | 0.9% |