NCLH stock forecast 2027–2029
MyStockButler's November 2026 analysis: NCLH's weighted price is $13.27 in November 2027 and $27.46 by November 2029. It hinges on turning yield recovery into cash before debt and ship spending absorb it.
Where could NCLH's shares go?
The weighted price is $13.27 in November 2027, a 24% loss including dividends. It rises to $20.09 in November 2028, a 14% gain. By November 2029, it reaches $27.46, a 56% gain.
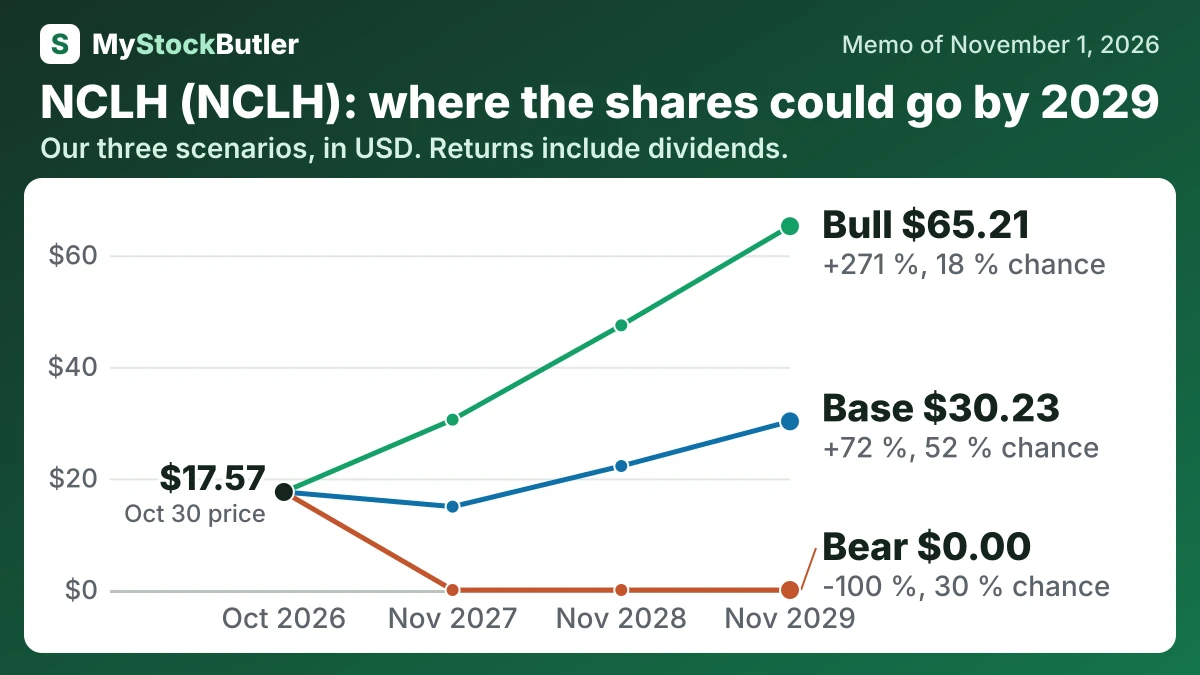
| Case | Probability | November 2027 | November 2028 | November 2029 |
|---|---|---|---|---|
| Bear | 30 % | 0.00 (-100 %) | 0.00 (-100 %) | 0.00 (-100 %) |
| Base | 52 % | 14.94 (-15 %) | 22.22 (+26 %) | 30.23 (+72 %) |
| Bull | 18 % | 30.53 (+74 %) | 47.44 (+170 %) | 65.21 (+271 %) |
| Weighted | 100 % | 13.27 (-24 %) | 20.09 (+14 %) | 27.46 (+56 %) |
What has to go right for NCLH, and what could go wrong?
EBITDA is anchored to management's $2.55 billion 2026 guide, against $2.73 billion reported for 2025. The recovery has been powerful, but 2025 free cash flow was negative $1.17 billion while capital spending reached $3.26 billion. The base case therefore rises from $2.72 billion in November 2027 to $3.12 billion in November 2029. It assumes the guided 2027 yield recovery and benefits from onboard spending, new ships, and destination investment.
The bear path runs from $2.38 billion to $2.48 billion because 2026 Net Yield is guided down 4.4%, while first-half 2027 bookings lagged despite stronger pricing. The bull path runs from $2.88 billion to $3.68 billion. It requires bookings to improve without fare concessions, then requires new capacity and savings to expand margins. The November figures blend two months of the preceding calendar year with ten months of the next.
| November 2027 | November 2028 | November 2029 | |
|---|---|---|---|
| EBITDA | 2,717 (2,383 / 2,883) | 2,917 (2,392 / 3,283) | 3,117 (2,483 / 3,683) |
| Shares (millions) | 463 (463 / 463) | 467 (506 / 467) | 471 (510 / 482) |
| Dividends per share | 0.00 (0.00 / 0.00) | 0.00 (0.00 / 0.00) | 0.00 (0.00 / 0.00) |
| Enterprise value to ebitda | 8.00 (6.50 / 10.00) | 8.50 (6.00 / 11.00) | 9.00 (5.50 / 12.00) |
| Net debt | 14,813 (15,547 / 14,687) | 14,413 (15,921 / 13,944) | 13,805 (16,732 / 12,781) |
How much cash does NCLH really make?
In 2025, operating cash was $2.1 billion while capital spending was $3.3 billion. The resulting free cash flow was negative $1.2 billion, compared with positive $838.9 million in 2024. The principal reason was the delivery of Norwegian Aqua and Oceania Allura. A company can therefore look healthy in daily operations while spending heavily to enlarge its earning capacity.
| 2025 | 2024 | 2023 | 2022 | 2021 | |
|---|---|---|---|---|---|
| Cash from operations | 2,089,746 | 2,049,823 | 2,005,714 | 210,020 | -2,468,009 |
| − Capital spending | 3,259,606 | 1,210,952 | 2,750,362 | 1,783,857 | 752,843 |
| = Free cash flow | -1,169,860 | 838,871 | -744,648 | -1,573,837 | -3,220,852 |
| − Stock pay | 88,393 | 91,781 | 118,940 | 113,563 | 124,077 |
| = Real free cash flow | -1,258,253 | 747,090 | -863,588 | -1,687,400 | -3,344,929 |
| Real free cash flow, % of revenue | -12.8% | 7.9% | -10.1% | -34.8% | -516.2% |
What this means. Free cash flow can be negative even when the business brings in cash because spending on equipment was greater than the cash from daily operations.
What does an investor pay for NCLH today?
Look at the current share price, market value, enterprise value and the principal valuation and cash-flow yields.