M&G dividend
MyStockButler's October 2026 analysis: M&G pays a dividend per share across the years shown, and dividends exceeded diluted EPS in every year shown. Cash coverage depends on operating capital generation becoming cash that subsidiaries can remit to the parent after capital needs and other outgoings.
How much does M&G pay its shareholders per share?
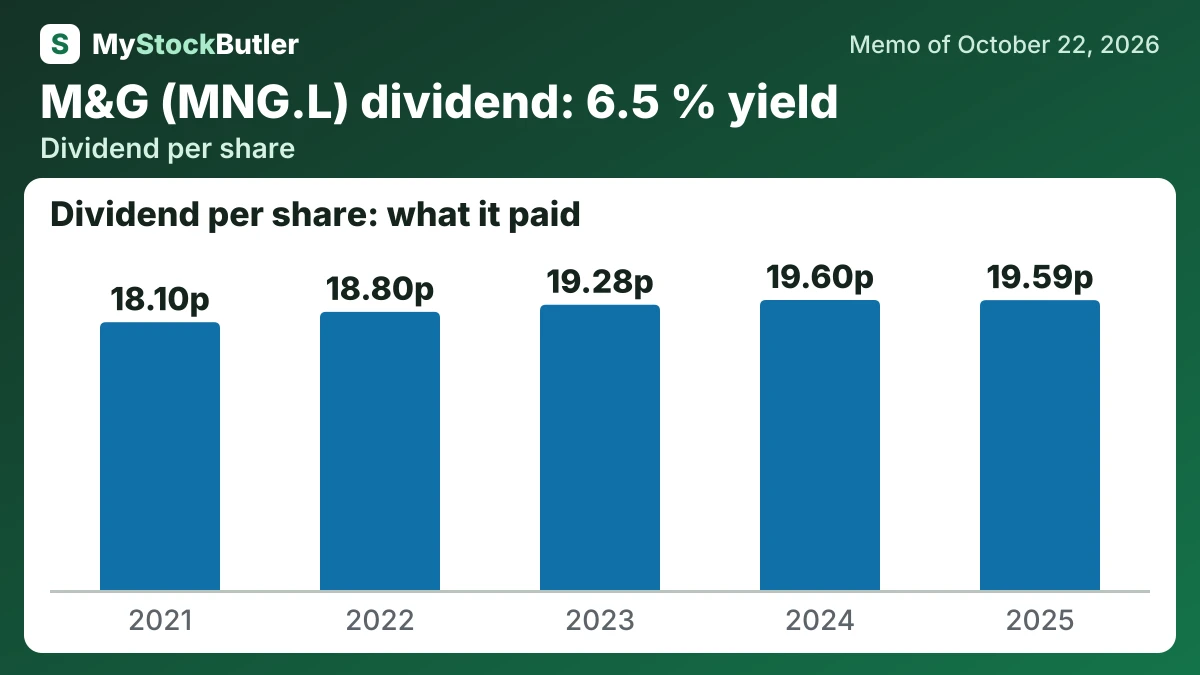
The shares trade at 313.60p and yield 6.5%; trailing P/E is not meaningful. Insurance revenue reached £4,425m in 2025, but operating return on equity is the test of stronger shareholder economics. Dividends exceeded diluted EPS in every year shown; in 2025, the payout exceeded EPS by 7.32p. Book value per share declined while diluted share count rose.
| 2025 | 2024 | 2023 | 2022 | 2021 | |
|---|---|---|---|---|---|
| EPS, diluted | 12.30 | -15.10 | 12.40 | -83.60 | 3.20 |
| − Dividends, per share | 19.59 | 19.60 | 19.28 | 18.80 | 18.10 |
| − Share buybacks, per share | 0.00 | 0.00 | 0.00 | 20.33 | 0.00 |
| = Paid out more, per share | 7.32 | 34.67 | 6.89 | 122.72 | 14.87 |
| Book value per share | 130.17 | 136.49 | 170.60 | 181.57 | 203.70 |
What this means. The company paid dividends even in years when it made a loss, so “paid out more” includes both the dividends and the amount it lost per share.
Is M&G’s dividend covered by its cash?
The pattern is clear: dividends exceeded earnings in every year shown, including years when M&G reported a loss. A buyback uses cash to purchase the company’s own shares, reducing the number left in circulation and potentially increasing each remaining share’s claim on future profits. But the cash cannot also fund acquisitions, absorb losses or support insurance promises.
The dividend yield is 6.5%, but the more useful companion measure is operating capital generation, or OCG. OCG is the surplus capital produced by the business before tax and certain other costs. M&G generated £765 million of OCG in 2025, equivalent to about 10.1% of today’s market value. That is a capital-generation yield, not a distributable cash yield: subsidiaries must first retain enough capital and safely remit the balance to the parent.
| 2025 | 2024 | 2023 | 2022 | 2021 | |
|---|---|---|---|---|---|
| Net income | 302 | -360 | 297 | -2,068 | 83 |
| = Earnings for common shareholders | 302 | -360 | 297 | -2,068 | 83 |
| − Dividends paid on ordinary shares | 482 | 468 | 462 | 465 | 466 |
| − Share buybacks | 0 | 0 | 0 | 503 | 0 |
| = Paid out more than it earned | 180 | 828 | 165 | 3,036 | 383 |
| Paid out, % of earnings for common | 159.6% | not meaningful | 155.6% | not meaningful | 561.4% |
What could change M&G’s dividend?
The near catalysts are adjusted operating profit, Asset Management efficiency and progress toward £2.7bn by year-end 2026 and through 2027. By end-2027, sustained external mandates, profitable fees and disciplined BPA pricing would support the growth case; weaker flows or pricing pressure would undermine it. From 2027–2029, repeated capital generation and remittances would support dividend growth and a higher valuation. Ground-rent reforms—the regular payments leaseholders make to the owner of the land beneath a property—and their timetable could affect capital and income.
Dividends remain progressive in the base case, rising from 0.210 per share to 0.220. The bear case holds the starting payout near 0.205 before cutting it to 0.195. The bull case reaches 0.235 through roughly 5% annual increases. The base path follows M&G’s progressive policy, but the bear case reflects that the payout exceeded net income in every year from 2021 through 2025 and that operating capital generation fell to £765m in 2025.
| October 2027 | October 2028 | October 2029 | |
|---|---|---|---|
| Book value | 2,969 (2,369 / 3,069) | 3,354 (2,459 / 3,604) | 3,774 (2,534 / 4,224) |
| Shares (millions) | 2,415 (2,416 / 2,399) | 2,420 (2,422 / 2,388) | 2,425 (2,428 / 2,377) |
| Dividends per share | 0.21 (0.20 / 0.21) | 0.21 (0.20 / 0.23) | 0.22 (0.20 / 0.23) |
| Price to book value | 2.90 (2.20 / 3.10) | 3.00 (1.90 / 3.40) | 3.10 (1.70 / 3.70) |
What this means. Price to book value compares the share price with the company's book value per share, so 2.90 means investors pay £2.90 for every £1 of company assets after debts.