M&G stock forecast 2027–2029
MyStockButler's October 2026 analysis: The weighted forecast is 320.28p by October 2027, with the bear case at 30%, the base case at 55% and the bull case at 15%. It hinges on M&G turning operating growth into capital that reaches the parent and supports dividends.
Where could M&G's shares go?
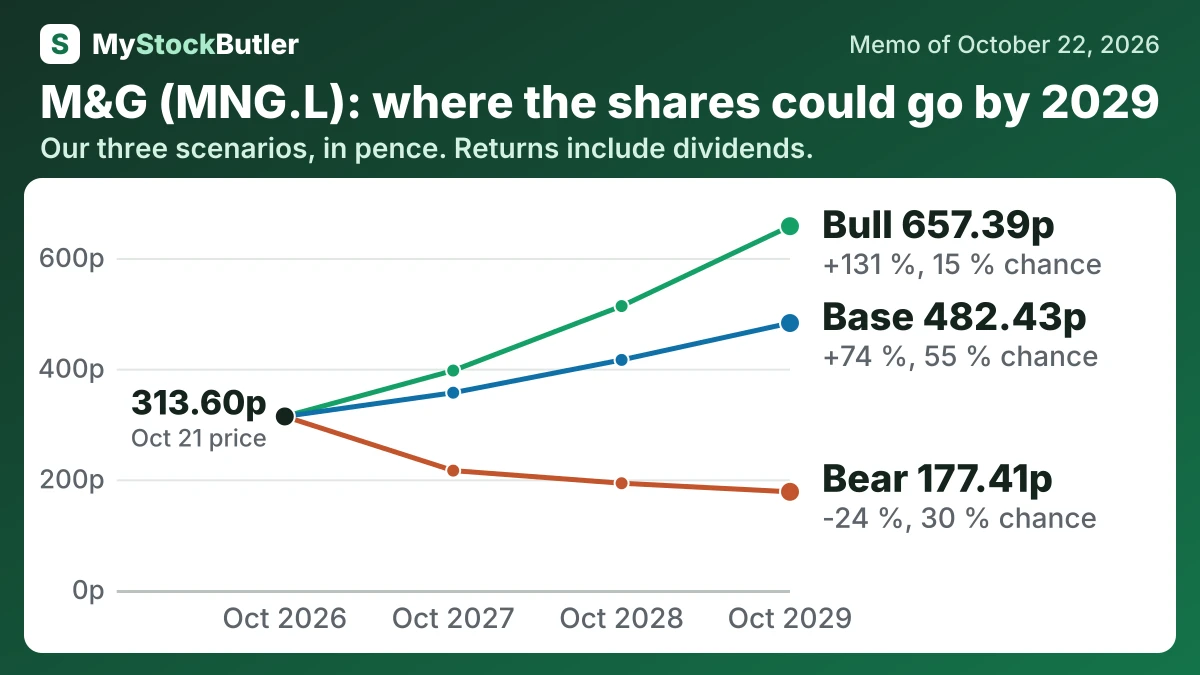
The weighted forecast is 320.28p by October 2027, a 9% total return including dividends. By October 2029, it reaches 417.17p, a 53% total return including dividends. The bear case has 30% probability. The base case has 55% and the bull case 15%.
| Case | Probability | October 2027 | October 2028 | October 2029 |
|---|---|---|---|---|
| Bear | 30 % | 215.71 (-25 %) | 192.89 (-26 %) | 177.41 (-24 %) |
| Base | 55 % | 356.51 (+20 %) | 415.77 (+46 %) | 482.43 (+74 %) |
| Bull | 15 % | 396.54 (+33 %) | 513.07 (+78 %) | 657.39 (+131 %) |
| Weighted | 100 % | 320.28 (+9 %) | 363.50 (+29 %) | 417.17 (+53 %) |
What this means. The weighted row is the average estimated share price after giving more weight to the base case because it is considered more likely.
What has to go right, and what could go wrong for M&G?
The bear case reaches only £2,369m in the first year and £2,534m in the last. It assumes weaker core earnings, higher dividends relative to earnings and a £400m reserve or market shock. The bull case rises from £3,069m to £4,224m because core earnings reach £950m initially and £1,150m finally, without a material reserve shock. The evidence supports caution: reported shareholders’ equity fell from £5,296m in 2021 to £3,136m in 2025, while the June 2026 book-value proxy fell to 108.71p per share.
| October 2027 | October 2028 | October 2029 | |
|---|---|---|---|
| Book value | 2,969 (2,369 / 3,069) | 3,354 (2,459 / 3,604) | 3,774 (2,534 / 4,224) |
| Shares (millions) | 2,415 (2,416 / 2,399) | 2,420 (2,422 / 2,388) | 2,425 (2,428 / 2,377) |
| Dividends per share | 0.21 (0.20 / 0.21) | 0.21 (0.20 / 0.23) | 0.22 (0.20 / 0.23) |
| Price to book value | 2.90 (2.20 / 3.10) | 3.00 (1.90 / 3.40) | 3.10 (1.70 / 3.70) |
What this means. Price to book value compares the share price with the company's book value per share, so 2.90 means investors pay £2.90 for every £1 of company assets after debts.
How much cash does M&G really make?
The dividend yield is 6.5%, but the more useful companion measure is operating capital generation, or OCG. OCG is the surplus capital produced by the business before tax and certain other costs. M&G generated £765 million of OCG in 2025, equivalent to about 10.1% of today’s market value. That is a capital-generation yield, not a distributable cash yield: subsidiaries must first retain enough capital and safely remit the balance to the parent.
| 2025 | 2024 | 2023 | 2022 | 2021 | |
|---|---|---|---|---|---|
| Operating capital generation | 765 | 933 | 996 | 821 | 1,117 |
| Total capital generation | 833 | 1,108 | 358 | -397 | 1,822 |
| Operating change in Contractual Service Margin (CSM) | 246 | 294 | 355 | 129 | |
| Net flows from open business (£ billions) | 7.8 | -1.9 | 1.7 | ||
| Shareholder Solvency II coverage ratio (%) | 242.0% | 223.0% | 203.0% | 199.0% | 218.0% |
What does an investor pay for M&G today?
At 313.60p on 22 October 2026, M&G’s ordinary shares had a market value of £7,558 million. That market capitalisation represents the shareholders’ residual claim after policyholders, lenders and other creditors are paid. The forward P/E is 10.2x: investors pay £10.20 for each £1 of forecast earnings. The recent trailing P/E is not meaningful, so the apparent cheapness depends on the forecast.