M&S dividend: history, cash cover and yield
MyStockButler's October 2026 analysis: M&S’s latest full-year dividend is 4.20p per share. Free cash flow was £91.4m against planned net capex of £650m–£750m, so cash coverage remains under pressure.
How much does M&S pay per share over the years shown?
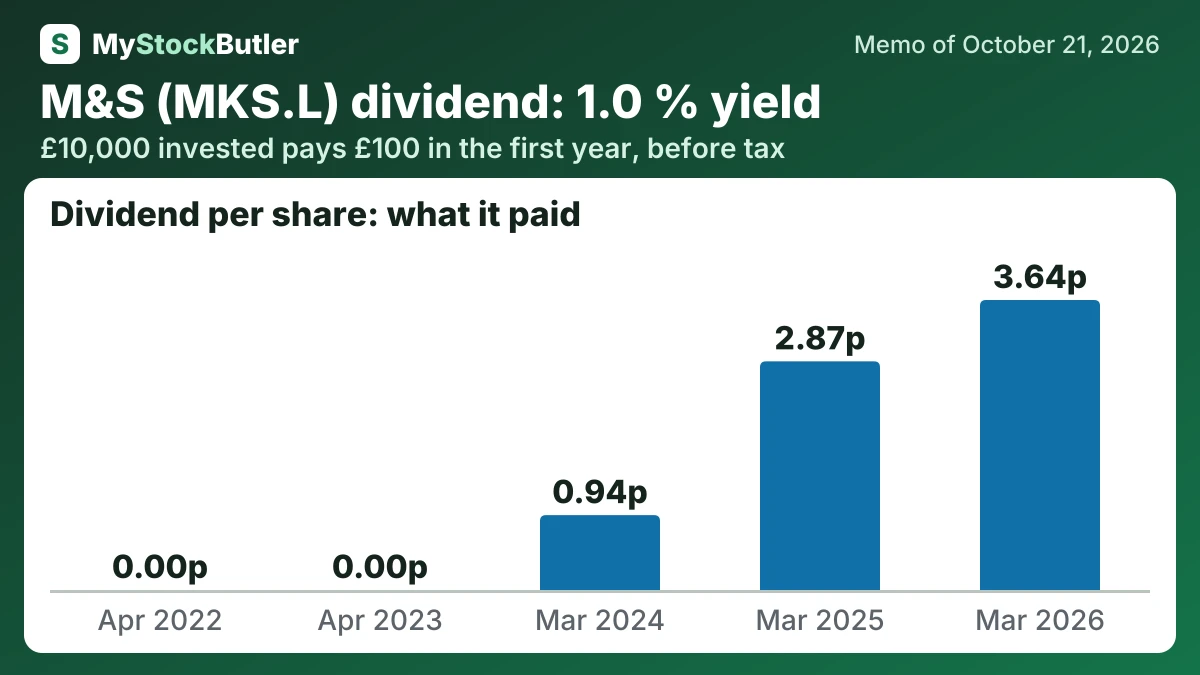
Dividends resumed cautiously. Cash dividends were zero in the first two years of the table and £77.0m in March 2026. On 20 May 2026, M&S increased the full-year dividend to 4.20p per share while keeping investment as its priority. Employee-trust share purchases are part of employee arrangements, not a public buyback programme. M&S has repaired its borrowing position, but the next question is whether its investment is earning enough to justify the cash it consumes.
| Mar 2026 | Mar 2025 | Mar 2024 | Apr 2023 | Apr 2022 | |
|---|---|---|---|---|---|
| Real free cash flow per share | 2.49 | 20.63 | 22.42 | 10.91 | 35.14 |
| Free cash flow per share | 4.32 | 23.12 | 24.75 | 12.77 | 37.05 |
| − Dividends paid, per share | 3.64 | 2.87 | 0.94 | 0.00 | 0.00 |
| − Share buybacks, per share | 1.00 | 3.85 | 4.00 | 0.00 | 0.00 |
What this means. The company's own free cash flow per share is negative while our count is positive because the company subtracts extra spending such as intangible assets, acquisitions, investments, and employee share payments.
How much would M&S's dividend pay you?
£10,000 invested in M&S at its 1.0% dividend yield (our report of October 21, 2026) pays £100.00 in the first year, before tax. If its dividend stays flat and the dividends are reinvested, year 10 pays £109.37, with £1,046.22 received in all.
Before tax. Past dividend growth is not a promise. Information only, not investment advice.
Does M&S’s cash cover its dividend?
The base dividend rises from 5p to 6p and then 7p per share. The bear gives 2p, 2p and 3p; the bull gives 6p, 8p and 10p. M&S raised the latest dividend to 4.2p, but free cash flow was only £91.4m against planned net capex of £650m–£750m.
| Mar 2026 | Mar 2025 | Mar 2024 | Apr 2023 | Apr 2022 | |
|---|---|---|---|---|---|
| Free cash flow | 91.4 | 487.9 | 513.7 | 259.8 | 752.6 |
| − Dividends paid | 77.0 | 60.5 | 19.6 | 0 | 0 |
| − Share buybacks | 21.1 | 81.3 | 83.1 | 0.1 | 0 |
| = Free cash flow not paid out | 346.1 | 411.0 | 259.7 | 752.6 | |
| = Paid out more than the free cash flow | 6.7 | ||||
| Paid to shareholders | 98.1 | 141.8 | 102.7 | 0.1 | 0 |
What could change M&S’s dividend?
The base case gains support if FY27 profit grows against FY25, as management expects. The bull case becomes credible in FY28 and FY29 if Food reaches its 4.0% margin goal, Fashion, Home & Beauty approaches 10%, and stronger cash generation permits buybacks or faster dividend growth.
| October 2027 | October 2028 | October 2029 | |
|---|---|---|---|
| Earnings | 540 (468 / 619) | 639 (478 / 768) | 725 (513 / 914) |
| Shares (millions) | 2,092 (2,100 / 2,086) | 2,104 (2,120 / 2,090) | 2,116 (2,140 / 2,096) |
| Dividends per share | 0.05 (0.02 / 0.06) | 0.06 (0.02 / 0.08) | 0.07 (0.03 / 0.10) |
| Price to earnings | 12.00 (10.00 / 14.00) | 12.00 (9.00 / 15.00) | 11.00 (8.00 / 16.00) |