Kingfisher stock forecast 2027–2029
MyStockButler's October 2026 analysis: The weighted scenario reaches 539.06p in October 2027. It hinges on lasting profit recovery, especially in France, and profitable trade growth.
Where could Kingfisher’s shares be by 2029?
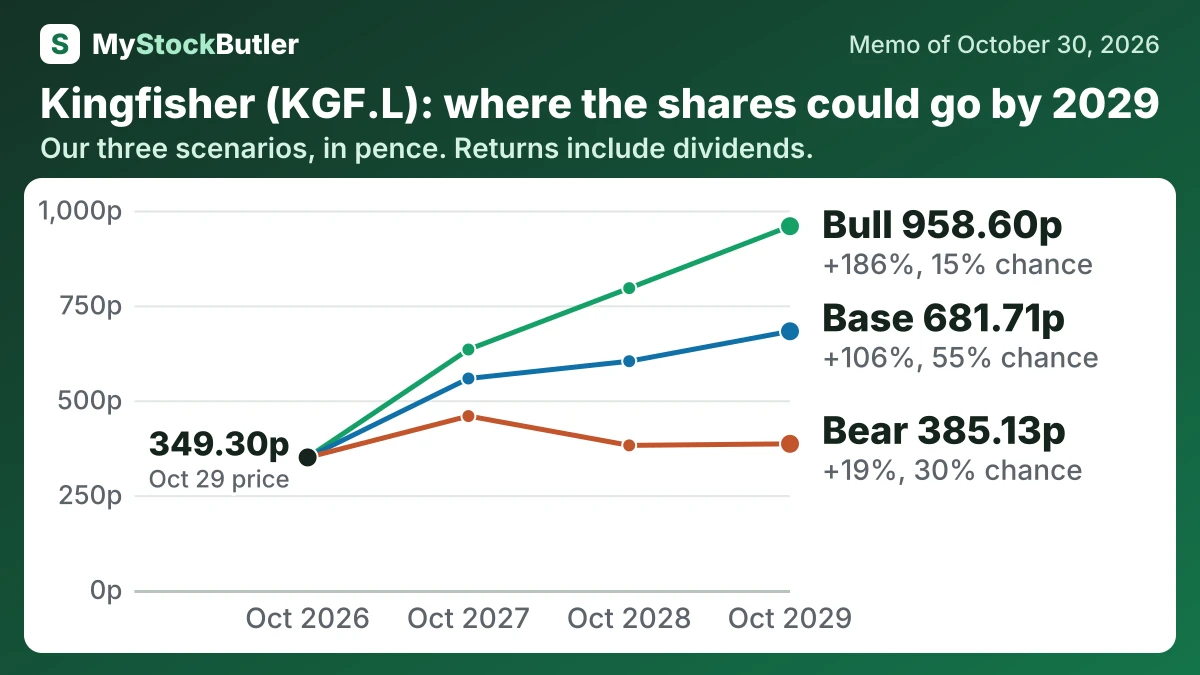
The weighted path reaches 539.06p in October 2027, a 58% return with dividends. It reaches 565.19p in October 2028, a 69% return. By October 2029, it reaches 634.27p, a 92% return.
At the final date, the bear case gives 385.13p, while the bull case gives 958.60p. Today’s reference price is 349.30p. The probabilities are 30% bear, 55% base and 15% bull.
| Case | Probability | October 2027 | October 2028 | October 2029 |
|---|---|---|---|---|
| Bear | 30% | 458.31 (+34%) | 381.05 (+15%) | 385.13 (+19%) |
| Base | 55% | 557.31 (+63%) | 602.85 (+80%) | 681.71 (+106%) |
| Bull | 15% | 633.66 (+85%) | 795.35 (+135%) | 958.60 (+186%) |
| Weighted | 100% | 539.06 (+58%) | 565.19 (+69%) | 634.27 (+92%) |
What this means. The weighted row is not another scenario; it is the probability-based average of the bear, base, and bull values.
What has to go right—and what could go wrong for Kingfisher?
The evidence supports recovery, but not a return to peak earnings. Recent adjusted operating income was £651m. The five-year statutory average was £665m, pulled up by a £1,144m pandemic-era result. The bear case begins at £690m, falls to £610m and recovers only to £625m as projects weaken and France remains poor. The bull case begins at £750m, then reaches £825m and £900m as project demand, trade growth and French margins improve. France’s retail margin was only 3.6% in the latest half-year, against 10.1% in the UK and Ireland.
How much real free cash flow does Kingfisher make?
Cash from operations was £1,433m in the year to January 2026. After capital spending, lease payments and interest, the accompanying calculation left £540m of free cash flow. After stock-based pay, it left £513m. That final deduction recognises the economic cost to shareholders even though the payment is non-cash.
| Jan 2026 | Jan 2025 | Jan 2024 | Jan 2023 | Jan 2022 | |
|---|---|---|---|---|---|
| = Free cash flow | 540 | 467 | 477 | -87 | 283 |
| − Stock pay | 27 | 20 | 22 | 19 | 27 |
| = Real free cash flow | 513 | 447 | 455 | -106 | 256 |
| Free cash flow, % of revenue | 4.2% | 3.7% | 3.7% | -0.7% | 2.1% |
| Real free cash flow, % of revenue | 4.0% | 3.5% | 3.5% | -0.8% | 1.9% |
What this means. The company's own free cash flow is £28 million lower because it subtracts a cash item we do not, while our real free cash flow is £1 million higher after subtracting £27 million of share-based pay.
What does an investor pay for Kingfisher today?
The table brings together the current share price, market value, enterprise value, valuation multiples, book value, cash-flow yields and dividend yield.
| Today (Oct 29, 2026) | |
|---|---|
| Share price | 349.3 |
| P/E, last 12 months (calculated) | 19.8x |
| P/E, next 12 months (calculated) | 12.0x |
| Free cash flow yield (calculated) | 9.5% |
| Real free cash flow yield (calculated) | 9.0% |
| Dividend yield (calculated) | 3.5% |
What this means. The enterprise value is lower than the market value because the company has more cash and short-term investments than debt.