Jacobs earnings date and guidance
MyStockButler's October 2026 analysis: Jacobs’ next results are expected on November 19, 2026. The key thing to watch is whether Jacobs’ growth produces spendable cash.
What has Jacobs guided?
Management’s promise is another year of growth, with cash conversion as important as earnings. For FY2026, Jacobs guides to adjusted EPS of $7.20–$7.30 and adjusted net revenue growth of 9.5%–10.0%. EPS is profit attributable to each share. Adjusted net revenue removes costs passed directly to subcontractors and equipment suppliers, so it better reflects Jacobs’ own fees.
| Period guided | Low | High | Date given | |
|---|---|---|---|---|
| Adjusted Net Revenue % Growth | FY2026 | 9.5% | 10.0% | Aug 4, 2026 |
| Adjusted EBITDA Margin | FY2026 | 14.7% | 14.8% | Aug 4, 2026 |
| Adjusted EPS | FY2026 | 7.20 | 7.30 | Aug 4, 2026 |
| Adjusted Free Cash Flow Margin | FY2026 | 8.0% | 8.0% | Aug 4, 2026 |
What this means. The company's adjusted free cash flow margin is its own version of cash flow, so it may not match our free cash flow margin.
Has Jacobs kept its past promises?
The record earns a mixed score. Across four comparable annual checks, adjusted EPS finished within its initial range each time. Cash conversion finished above target once, within it twice and below it once; FY2022 was the weak year, at 97%. The FY2023 result met the original EPS range but missed the final one. The older $10 FY2025 target cannot be tested against today’s smaller Jacobs because the Amentum separation changed the businesses supplying earnings. Adjusted targets also cannot be reconciled to GAAP because future transaction, restructuring and integration charges are too uncertain.
| What management forecast | Checked | Above | Within | Below |
|---|---|---|---|---|
| Adjusted EPS | 4 years | 0 | 4 | 0 |
| Free cash flow conversion | 4 years | 1 | 2 | 1 |
What this means. The total says three of five promises were kept, but the two rows show eight yearly checks, so it is unclear how that total was calculated.
How have Jacobs revenue and profit trended?
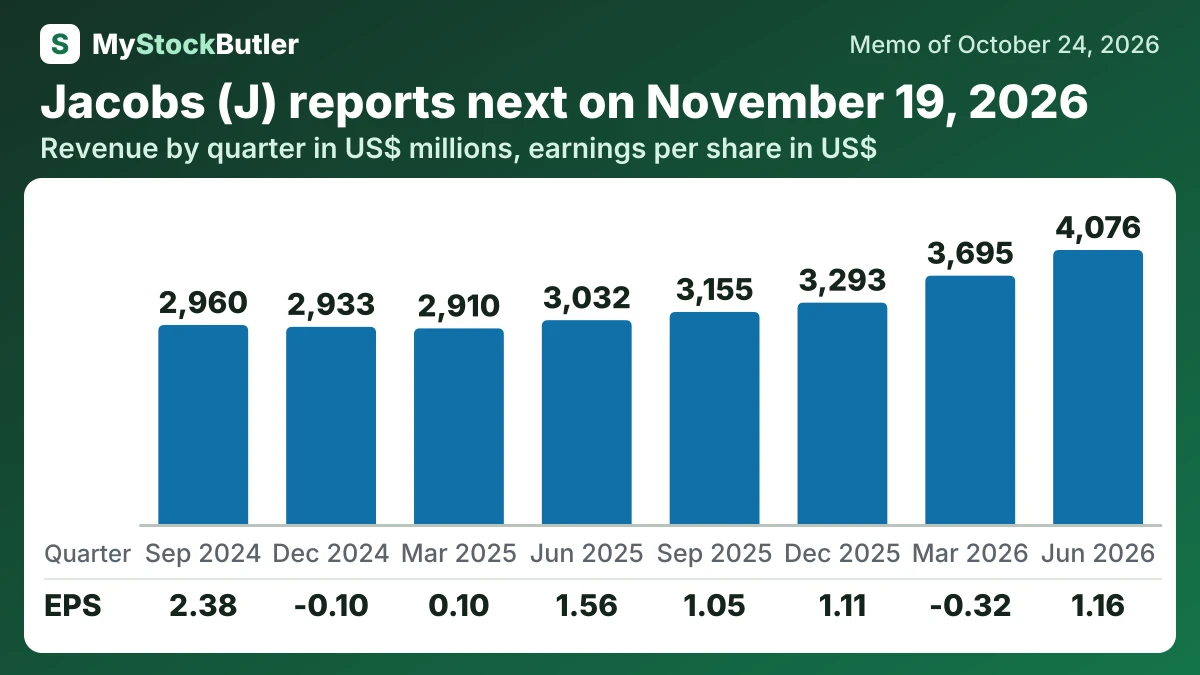
Jacobs’ accounts support an improving service business, but the improvement is clearest in fees and segment earnings rather than reported EPS.
| Jun 2026 | Mar 2026 | Dec 2025 | Sep 2025 | Jun 2025 | Mar 2025 | Dec 2024 | Sep 2024 | |
|---|---|---|---|---|---|---|---|---|
| Revenue | 4,076,410 | 3,694,881 | 3,293,281 | 3,154,644 | 3,031,768 | 2,910,415 | 2,932,956 | 2,960,150 |
| Operating income | 286,703 | -81,176 | 232,561 | 211,554 | 235,014 | 208,648 | 208,417 | 196,205 |
| Net income | 137,359 | -42,993 | 124,954 | 138,036 | 181,234 | 11,162 | -17,129 | 309,299 |
| EPS, diluted | 1.16 | -0.32 | 1.11 | 1.05 | 1.56 | 0.10 | -0.10 | 2.38 |
What this means. March 2026's negative free cash flow does not mean sales stopped; large cash payments tied to buying PA Consulting pulled cash down.
What should I watch in Jacobs’ next results?
The next results and PA deadlines will reveal whether Jacobs’ growth produces spendable cash. FY2026 full-year results and the FY2027 outlook are expected in November 2026. They should show how much pipeline conversion management is willing to include in the next forecast; strong growth with slower collections would be a weaker result than the headline suggests.