Gartner stock forecast 2027–2029
MyStockButler's October 2026 analysis: Gartner's weighted forecast puts shares at $227.83 in October 2027, a 1% loss. It hinges on whether positive contract activity becomes broader revenue growth.
Where could Gartner's shares be?
The weighted forecast puts shares at $227.83 in October 2027, a 1% loss. It reaches $337.33 in October 2029, a 46% gain including dividends. Bear probability is 30%. Base probability is 55%; bull probability is 15%.
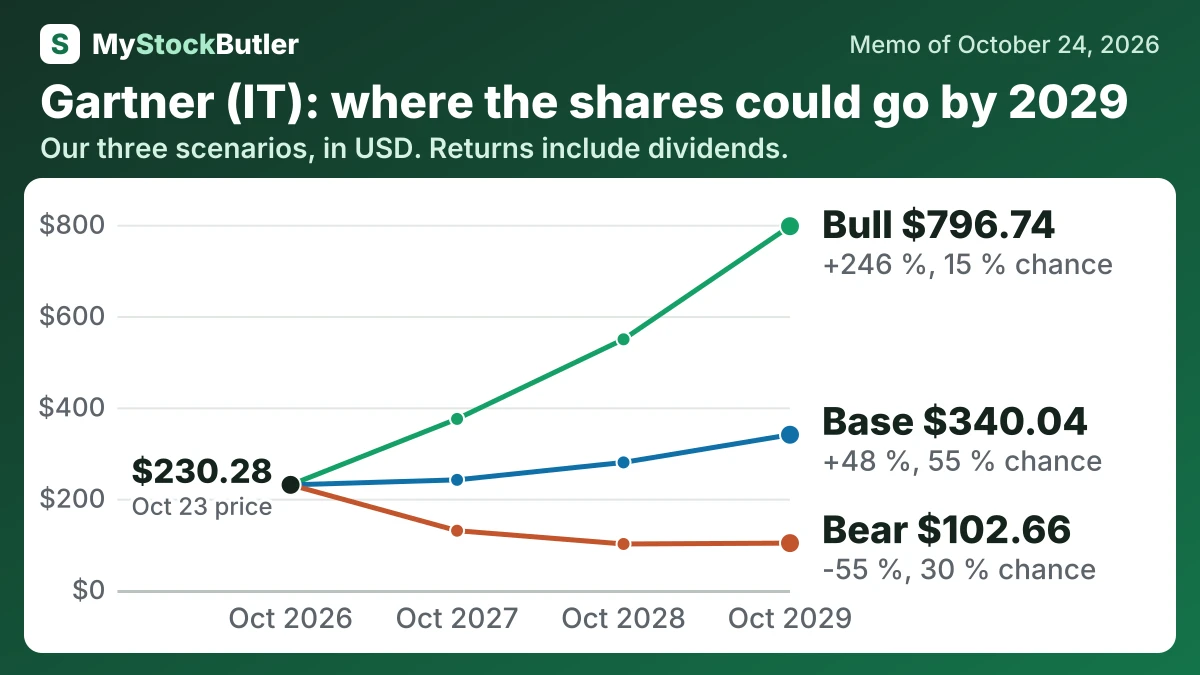
| Case | Probability | October 2027 | October 2028 | October 2029 |
|---|---|---|---|---|
| Bear | 30 % | 129.84 (-44 %) | 100.78 (-56 %) | 102.66 (-55 %) |
| Base | 55 % | 241.22 (+5 %) | 279.45 (+21 %) | 340.04 (+48 %) |
| Bull | 15 % | 374.69 (+63 %) | 549.04 (+138 %) | 796.74 (+246 %) |
| Weighted | 100 % | 227.83 (-1 %) | 266.29 (+16 %) | 337.33 (+46 %) |
What this means. The weighted row is the probability-based average of the bear, base, and bull cases, so it can differ from the base case.
What has to go right for Gartner, and what could go wrong?
The decision point is whether positive contract activity becomes broader revenue growth. Gartner reports third-quarter results before the market opens on November 3, 2026. In June 2026, contract value grew 1.7%. Wallet retention was 98.2%. Sustained improvement toward or above full replacement would support the base case. The bull case needs paid expansion from broader Insights and AskGartner, Gartner’s AI tool for answering client questions using its research. Weak renewals or seller productivity would push the outlook toward the bear case.
| October 2027 | October 2028 | October 2029 | |
|---|---|---|---|
| Free cash flow after stock pay | 1,070 (900 / 1,200) | 1,170 (850 / 1,400) | 1,260 (900 / 1,630) |
| Shares (millions) | 59.95 (62.50 / 57.33) | 56.75 (61.85 / 51.51) | 53.55 (61.20 / 45.69) |
| Enterprise value to free cash flow after stock pay | 15.00 (11.00 / 19.00) | 15.00 (10.00 / 21.00) | 16.00 (10.00 / 23.00) |
| Net debt | 1,589 (1,785 / 1,319) | 1,691 (2,267 / 1,119) | 1,951 (2,717 / 1,087) |
What this means. The number of shares falls over time because the forecast assumes the company buys back shares, so each remaining share represents a larger piece of the company.
How much cash does Gartner really make?
Stock compensation creates a second adjustment. It reduces accounting profit but requires no immediate cash payment. Subtracting 2025 stock pay leaves analytical “real free cash flow” of $1.0 billion, or 15.7% of revenue. That measure asks what remains after recognizing the cost of paying employees with ownership.
| 2025 | 2024 | 2023 | 2022 | 2021 | |
|---|---|---|---|---|---|
| Cash from operations | 1,290,365 | 1,484,922 | 1,155,737 | 1,101,422 | 1,312,470 |
| − Capital spending | 115,142 | 101,737 | 103,124 | 108,050 | 59,834 |
| = Free cash flow | 1,175,223 | 1,383,185 | 1,052,613 | 993,372 | 1,252,636 |
| − Stock pay | 155,877 | 154,784 | 129,841 | 90,566 | 98,570 |
| = Real free cash flow | 1,019,346 | 1,228,401 | 922,772 | 902,806 | 1,154,066 |
| Real free cash flow, % of revenue | 15.7% | 19.6% | 15.6% | 16.5% | 24.4% |
What this means. The company's free cash flow is slightly different from ours because it rounds its figures and makes a few small adjustments; our count uses the exact numbers shown.
What does an investor pay for Gartner today?
At $230.28 in the October 24, 2026 valuation snapshot, Gartner trades at a trailing P/E of 20.7 times. The forward P/E is 14.0 times because it uses predicted earnings rather than the past year’s profit. At this price, that forecast implies roughly $16.45 of earnings per share. The apparent bargain therefore depends on earnings that Gartner has not yet earned.