Host Hotels & Resorts earnings
MyStockButler's October 2026 analysis: Host Hotels & Resorts' next results are expected on November 4, 2026. The key watch for Host Hotels & Resorts is whether it maintains its annual outlook and separates World Cup demand from normal leisure and group business.
What has Host Hotels & Resorts guided for 2026?
On August 5, 2026, management guided to 4.8%–5.3% 2026 comparable RevPAR growth. It forecast Adjusted FFO of $2.15–$2.18 per share. It also forecasts $550–$630 million of total capital expenditures in 2026, including renewal work and ROI projects, hotel upgrades expected to earn a return through improved performance.
| Period guided | Low | High | Date given | |
|---|---|---|---|---|
| Adjusted FFO per diluted share | 2026 | 2.15 | 2.18 | 2026-08-05 |
| Comparable hotel Total RevPAR growth | 2026 | 4.8% | 5.3% | 2026-08-05 |
| Comparable hotel RevPAR growth | 2026 | 4.8% | 5.3% | 2026-08-05 |
| Total Capital Expenditures | 2026 | 550 | 630 | 2026-08-05 |
What this means. The growth ranges shown as 4.8%–5.3% are rounded from the company's more exact 4.75%–5.25% forecast, so the displayed endpoints are not the original figures.
What promises has Host Hotels & Resorts kept?
Host’s forecasting record is broadly encouraging, though not flawless. Most scored initial forecasts landed within or above their eventual results, but net income and earnings per share overlap, and later results benefited from sales and insurance. Management cut guidance during weaker recovery periods, and 2025’s final results slightly missed approximate forecasts. The record supports reasonable confidence, not certainty.
| What management forecast | Checked | Above | Within | Below |
|---|---|---|---|---|
| Net income | 4 years | 2 | 1 | 1 |
| Adjusted EBITDAre | 4 years | 2 | 2 | 0 |
| Diluted earnings per common share | 4 years | 2 | 2 | 0 |
What this means. The overall score says four of five promises were kept, but each row shows only four years, so the totals do not seem to match.
How have Host Hotels & Resorts results trended?
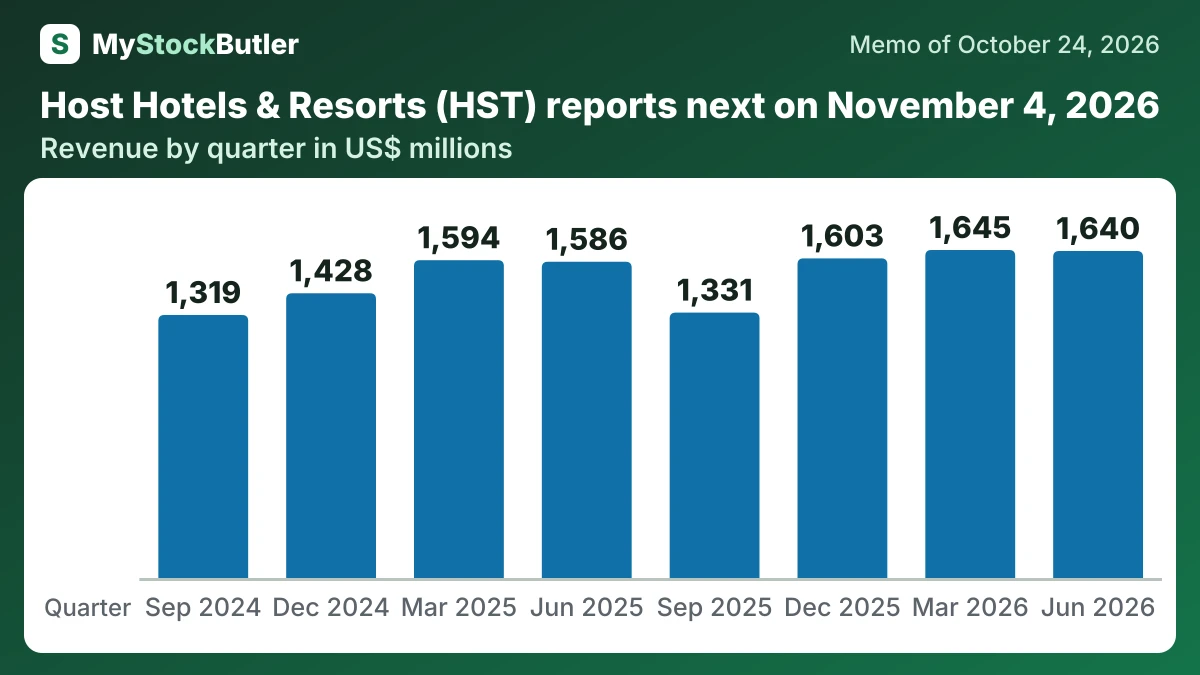
Revenue rose from $1,586 million to $1,640 million in June 2026. Net operating income rose from $488 million to $506 million. Occupancy improved from 73.6% to 74.8%, while comparable RevPAR increased 7.0%. Comparable Total RevPAR rose 5.9%, and comparable hotel EBITDA margin reached 31.9%, up 60 basis points. Same-hotel performance therefore improved more clearly than consolidated revenue.
| Jun 2026 | Mar 2026 | Dec 2025 | Sep 2025 | Jun 2025 | Mar 2025 | Dec 2024 | Sep 2024 | |
|---|---|---|---|---|---|---|---|---|
| Revenue | 1,640 | 1,645 | 1,603 | 1,331 | 1,586 | 1,594 | 1,428 | 1,319 |
| Net operating income | 506 | 525 | 422 | 319 | 488 | 502 | 402 | 328 |
| FFO per share | 0.62 | 0.66 | 0.49 | 0.34 | 0.57 | 0.63 | 0.44 | 0.36 |
| AFFO per share (company's measure) | 0.63 | 0.67 | 0.51 | 0.35 | 0.58 | 0.64 | 0.45 | 0.36 |
| Regular dividend per share | 0.20 | 0.20 | 0.20 | 0.20 | 0.20 | 0.20 | 0.20 | 0.20 |
| Occupancy | 74.8% | 70.0% | 66.8% | 69.1% | 73.6% | 69.0% | 66.5% | 71.4% |
What this means. The occupancy percentages show the average share of rooms sold during each quarter, not how full the properties were on the last day.
What should you watch in Host Hotels & Resorts' next results?
Third-quarter results arrive after the market closes on November 4, 2026. The earnings call follows at 10 a.m. Eastern on November 5. Investors should ask whether Host maintains its annual outlook and separates World Cup demand from normal leisure and group business.
By year-end, watch whether Manchester Grand Hyatt San Diego is substantially complete and whether renovated hotels improve as operating guarantees fade. Compare that progress with Maui and The Don CeSar, where guidance assumes hotel EBITDA of $120 million and $29 million respectively. A recovery can create impressive growth simply because the earlier period was weak; sustainable trading matters more than the rebound percentage.