Host Hotels & Resorts stock forecast 2027–2029
MyStockButler's October 2026 analysis: Host Hotels & Resorts' weighted scenario reaches $23.64 in October 2029, with bear, base and bull probabilities of 25%, 55% and 20%. It hinges on post-event demand, renovation cash returns and capital allocation.
Where could Host Hotels & Resorts' shares be by October 2029?
The forecast puts the shares at $22.08 in October 2027, for an 8% loss from today’s $24.72 after including dividends. The weighted price is $22.13 in October 2028, a 5% loss, and $23.64 in October 2029, a 5% gain.
The range is wide. By October 2029, the bear case reaches $14.80 while the bull case reaches $37.32, against today’s $24.72. The bear, base and bull probabilities are 25%, 55% and 20%, respectively.
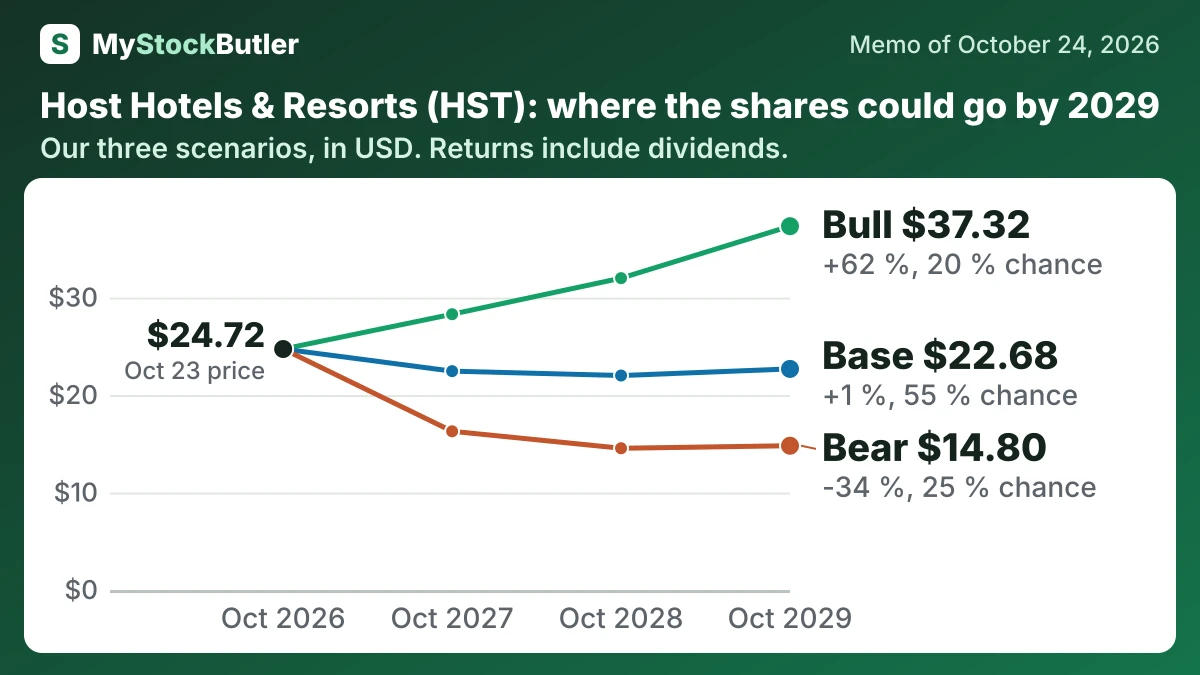
| Case | Probability | October 2027 | October 2028 | October 2029 |
|---|---|---|---|---|
| Bear | 25 % | 16.28 (-32 %) | 14.54 (-37 %) | 14.80 (-34 %) |
| Base | 55 % | 22.45 (-6 %) | 22.00 (-5 %) | 22.68 (+1 %) |
| Bull | 20 % | 28.29 (+18 %) | 31.99 (+36 %) | 37.32 (+62 %) |
| Weighted | 100 % | 22.08 (-8 %) | 22.13 (-5 %) | 23.64 (+5 %) |
What has to go right for Host Hotels & Resorts, and what could go wrong?
The bear path falls to $1,400 million, then $1,340 million, before recovering to $1,370 million. It assumes event benefits fade, group demand weakens and renovation disruption limits cash earnings. The bull path reaches $1,600 million in 2027 and $1,720 million in 2028, then $1,840 million in 2029. It requires strong bookings to persist, new rooms to be absorbed and renovated hotels to sustain their competitive gains.
How much cash does Host Hotels & Resorts really make?
Operating cash flow was $1.510 billion in 2025. After $644 million of hotel capital expenditures, about $866 million remained before other uses. After $623 million of cash dividends, about $243 million remained before buybacks, acquisitions and financing movements. This is a cash bridge for that year, not a permanent free-cash-flow rate.
| 2025 | 2024 | 2023 | 2022 | 2021 | |
|---|---|---|---|---|---|
| AFFO (company's measure) | 1,436 | 1,411 | 1,370 | 1,286 | 437 |
| AFFO per share (company's measure) | 2.07 | 2.00 | 1.92 | 1.79 | 0.61 |
| Dividends paid | 623 | 737 | 547 | 150 | 0 |
| AFFO payout ratio | 38.6% | 40.0% | 33.9% | 18.4% | 0.0% |
What this means. The company's adjusted funds from operations changed its definition, so the yearly numbers are not perfectly comparable.
What does an investor pay for Host Hotels & Resorts today?
The 11.4-times adjusted-FFO multiple implies an earnings yield of about 8.8%. That is not a free-cash-flow yield. Host’s August 2026 adjusted FFO guidance had a midpoint of $1.489 billion. Subtracting the $295 million midpoint of ordinary renewals leaves an earnings-based cash yield of about 7.1% of today’s equity value. Including all planned capital spending, whose midpoint was $590 million, lowers that approximation to about 5.3%. Working capital and other cash movements still matter.
| Today (Oct 24, 2026) | |
|---|---|
| Share price | 24.72 |
| Market value (calculated) | 16,936.28 |
| Price to FFO (calculated) | 11.7x |
| Price to AFFO (calculated) | 11.4x |
| Dividend yield (calculated) | 3.2% |
What this means. The market value leaves out operating partnership units held by other investors, so it may be lower than the value of the entire business.