Gen Digital stock forecast 2027–2029
MyStockButler's October 2026 analysis: The weighted scenario is $21.65 in October 2027 and $31.62 in October 2029, including dividends. It hinges on whether MoneyLion growth can coexist with lower leverage.
Where could Gen Digital's shares be by October 2029?
Our weighted price is $21.65 in October 2027, a 24% loss including dividends. It reaches $31.62 in October 2029, a 13% gain including dividends. The bear probability is 25%. The base probability is 55%. The bull probability is 20%.
The range is wide because cash flow and the valuation multiple can move together. By October 2029, the bear case gives $8.13, while the bull case gives $58.89. The probability mix is 25% bear, 55% base and 20% bull.
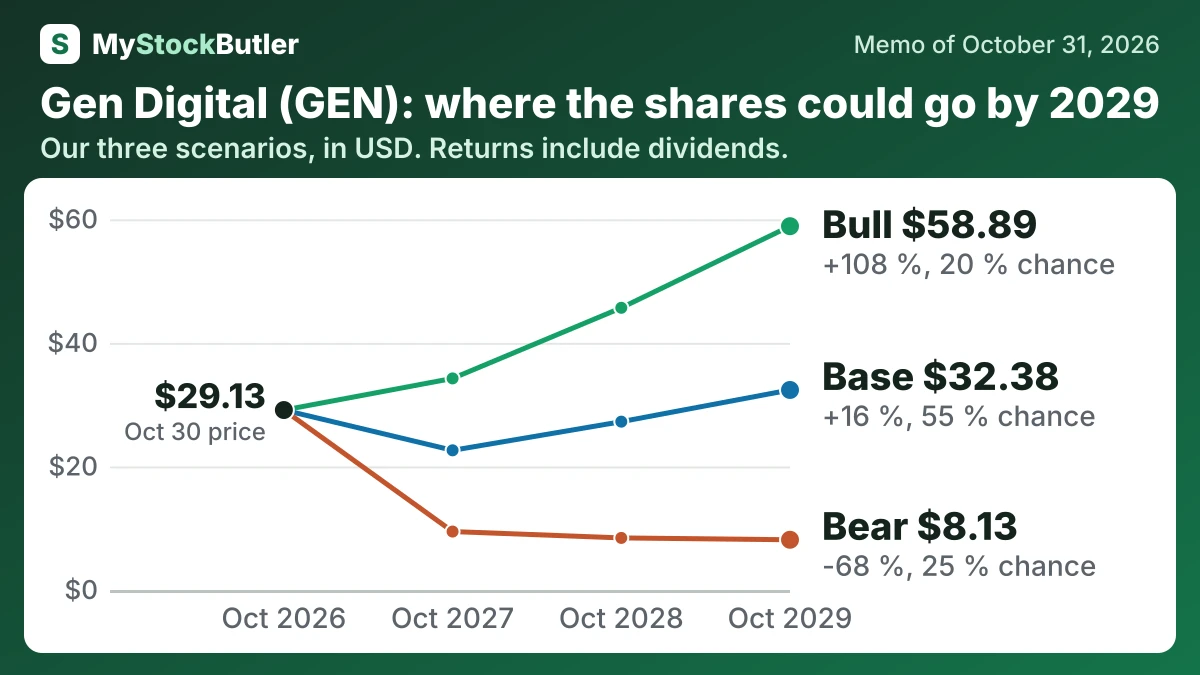
| Case | Probability | October 2027 | October 2028 | October 2029 |
|---|---|---|---|---|
| Bear | 25 % | 9.46 (-66 %) | 8.43 (-68 %) | 8.13 (-68 %) |
| Base | 55 % | 22.61 (-21 %) | 27.25 (-3 %) | 32.38 (+16 %) |
| Bull | 20 % | 34.25 (+19 %) | 45.68 (+60 %) | 58.89 (+108 %) |
| Weighted | 100 % | 21.65 (-24 %) | 26.23 (-7 %) | 31.62 (+13 %) |
What has to go right or wrong for Gen Digital?
That first value is below the trailing $1,539 million because working capital and tax timing have made recent cash conversion unusually uneven. The first half generated $753 million, up 47% year over year, while FY2024 benefited from an $899 million tax refund. The bear case falls to $1,150 million, stays there for a year and reaches $1,185 million; the bull case starts at $1,500 million and grows 9% annually to $1,782 million. The bear reflects Instacash losses, partner sharing and acquisition costs; the bull requires stronger bookings, retention and cross-sell.
How much cash does Gen Digital really make?
Stock compensation complicates that measure. Gen awarded employees shares valued at $237 million. No equivalent cash left the company that year, but existing shareholders were diluted. Deducting the award leaves analytical “real free cash flow” of $1,286 million, or 25.7% of revenue.
| Apr 2026 | Mar 2025 | Mar 2024 | Mar 2023 | Apr 2022 | |
|---|---|---|---|---|---|
| = Free cash flow | 1,523 | 1,206 | 2,044 | 751 | 968 |
| − Stock pay | 237 | 133 | 138 | 134 | 70 |
| = Real free cash flow | 1,286 | 1,073 | 1,906 | 617 | 898 |
| Free cash flow, % of revenue | 30.5% | 30.6% | 53.8% | 22.6% | 34.6% |
| Real free cash flow, % of revenue | 25.7% | 27.3% | 50.2% | 18.6% | 32.1% |
What this means. For the year ending April 2022, the company's own free cash flow is 5 million dollars higher than ours because it leaves out a cash cost we count.
What does an investor pay for Gen Digital today?
The current share price is $29.13 and the current cash-flow multiple is 16.1x. That starting point matters because the base case begins slightly below it, while the bull case requires a rerating.
| Today (Oct 31, 2026) | |
|---|---|
| Share price | 29.13 |
| Market value (calculated) | 17,282.13 |
| Enterprise value (calculated) | 24,809.13 |
| P/E, last 12 months (calculated) | 14.6x |
| Free cash flow yield (calculated) | 8.8% |
| Real free cash flow yield (calculated) | 7.4% |