F&C dividend
MyStockButler's October 2026 analysis: F&C paid a 4.15p dividend per share in 2025, covered by 4.49p of net revenue return, or about 1.08-times cover. But F&C paid shareholders more than it generated in free cash flow from 2021 through 2025, using portfolio capital as well as investment income.
How much does F&C pay in dividends?
The base dividend rises from 4.36p to 4.58p and then 4.81p. The bear case cuts it to 4.15p, while the bull case reaches 5.00p. Gradual growth follows 55 consecutive annual increases and 1.08-times revenue cover in 2025. The downside remains possible because first-half 2026 revenue earnings were 2.84p per share and the company warns that this does not predict the full year.
| 2025 | 2024 | 2023 | 2022 | 2021 | |
|---|---|---|---|---|---|
| Free cash flow per share | 3.08 | 2.95 | 2.87 | 2.20 | 1.83 |
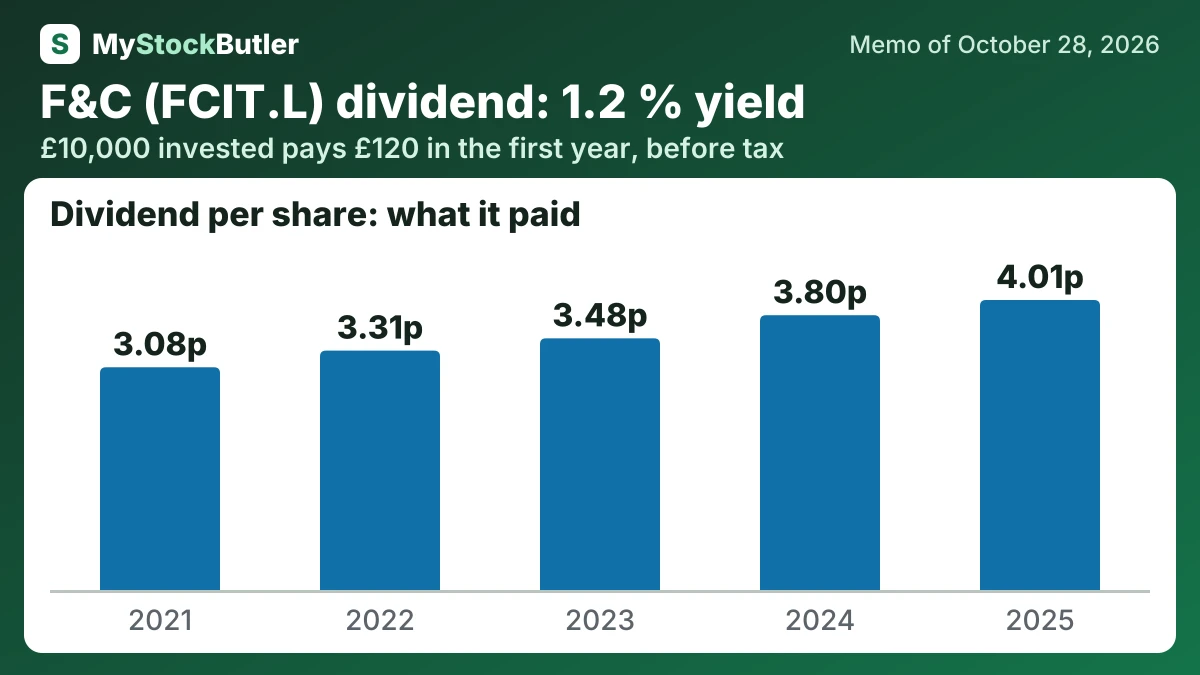
| − Dividends paid, per share | 4.01 | 3.80 | 3.48 | 3.31 | 3.08 |
| = Paid out more than FCF, per share | 5.95 | 15.01 | 4.18 | 4.53 | 5.19 |
| Stock pay per share | 0.00 | 0.00 | 0.00 | 0.00 | 0.00 |
What this means. The earnings per share figures are not strictly diluted earnings: they use the company’s basic return per share and include investment gains and losses.
How much would F&C's dividend pay you?
£10,000 invested in F&C at its 1.2% dividend yield (our report of October 28, 2026) pays £120.00 in the first year, before tax. If its dividend per share keeps changing 6.8% a year, as it did from 2021 to 2025, and the dividends are reinvested, year 10 pays £250.31, with £1,770.41 received in all.
Before tax. Past dividend growth is not a promise. Information only, not investment advice.
Is F&C's dividend covered by its cash?
F&C paid shareholders more than it generated in free cash flow from 2021 through 2025, so it used portfolio capital as well as investment income.
In 2025, net revenue return was 4.49p per share against a dividend of 4.15p. That is about 1.08-times cover, and it supported the 55th consecutive annual increase.
| 2025 | 2024 | 2023 | 2022 | 2021 | |
|---|---|---|---|---|---|
| Free cash flow | 59,023 | 58,646 | 59,321 | 45,989 | 39,039 |
| − Dividends paid | 76,949 | 75,604 | 71,837 | 68,983 | 65,578 |
| − Share buybacks | 96,228 | 281,473 | 73,645 | 71,534 | 83,961 |
| = Paid out more than the free cash flow | 114,154 | 298,431 | 86,161 | 94,528 | 110,500 |
| Paid out, % of free cash flow | 293.4% | 608.9% | 245.2% | 305.5% | 383.1% |
What this means. The company's own net debt differs because it includes forward exchange contracts and leaves out some short-term investments, while our figure counts them.
What is F&C's dividend yield today?
Suppose an investor wants roughly 8% a year before personal taxes and dealing costs. If the discount stays unchanged and the dividend yield remains around 1.2%, NAV per share would need to grow by roughly 6.8% a year. That is an illustration, not a promise: dividends and market returns will vary.
The probability-weighted price is 357.30p in October 2027. That is a 6% return including dividends from today's 341.60p. The weighted price reaches 374.93p in October 2028 and 394.00p in October 2029, equivalent to 12% and 19% returns.
| Today (Oct 28, 2026) | |
|---|---|
| Share price | 341.60 |
| Free cash flow yield (calculated) | 0.9% |
| Real free cash flow yield (calculated) | 0.9% |
| Dividend yield (calculated) | 1.2% |
What this means. The price-to-earnings number appears to use investment returns including share-price gains, rather than just the company's profit, so it may not be a normal price-to-earnings measure.