F&C stock forecast 2027–2029
MyStockButler's October 2026 analysis: F&C's weighted scenario is 357.30p in October 2027. F&C's outcome hinges on NAV growth and a stable discount.
Where could F&C's shares be by October 2029?
The probability-weighted price is 357.30p in October 2027. That is a 6% return including dividends from today's 341.60p. The weighted price reaches 374.93p in October 2028 and 394.00p in October 2029, equivalent to 12% and 19% returns.
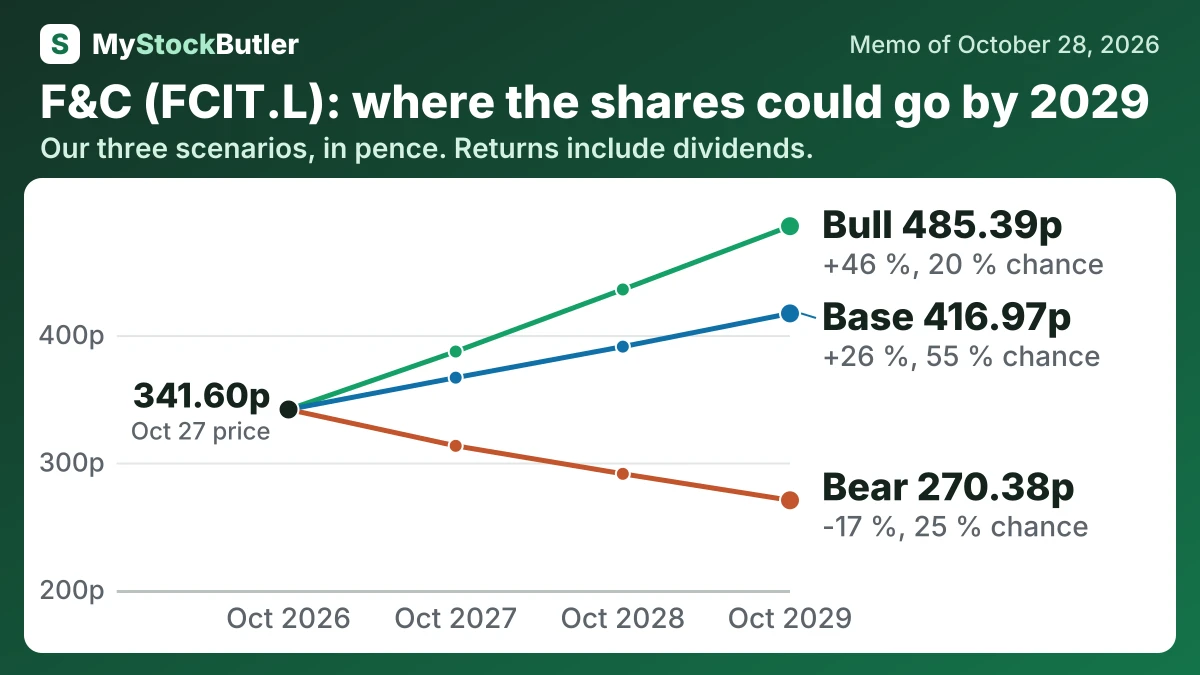
| Case | Probability | October 2027 | October 2028 | October 2029 |
|---|---|---|---|---|
| Bear | 25 % | 313.09 (-7 %) | 291.13 (-12 %) | 270.38 (-17 %) |
| Base | 55 % | 366.58 (+9 %) | 390.91 (+17 %) | 416.97 (+26 %) |
| Bull | 20 % | 387.06 (+15 %) | 435.75 (+30 %) | 485.39 (+46 %) |
| Weighted | 100 % | 357.30 (+6 %) | 374.93 (+12 %) | 394.00 (+19 %) |
What this means. The weighted row is the probability-based average of the bear, base, and bull cases, not a separate prediction.
What has to go right, and what could go wrong for F&C?
The bear case assumes a negative 2.5% annual NAV return. After distributions and reduced buybacks, book value falls about 4.2% each year. The bull case assumes a 10.0% return, less 1.2% for dividends and 1.3% for buybacks. That requires broader market gains, stronger manager selection and successful private-equity realisations.
How much cash does F&C really make?
Cash returns included a 0.9% free-cash-flow yield and a 1.2% dividend yield. Buybacks added a 1.5% yield; the 4.5x P/E reflects investment gains, not stable operating profit. Revenue growth slowed to 1.3% in 2025. F&C’s free cash flow stayed steady across five years, but net debt reached £496,654 thousand in 2025. Per share, free cash flow was 3.08p against 4.01p of dividends; buybacks were 5.01p. Book value reached 325.16p.
| 2025 | 2024 | 2023 | 2022 | 2021 | |
|---|---|---|---|---|---|
| Cash from operations | 59,023 | 58,646 | 59,321 | 45,989 | 39,039 |
| − Interest paid | 0 | 0 | 0 | 0 | 0 |
| = Free cash flow | 59,023 | 58,646 | 59,321 | 45,989 | 39,039 |
| − Stock pay | 0 | 0 | 0 | 0 | 0 |
| = Real free cash flow | 59,023 | 58,646 | 59,321 | 45,989 | 39,039 |
| Real free cash flow, % of revenue | 52.1% | 52.5% | 55.6% | 47.8% | 50.3% |
What this means. Free cash flow equals cash from operations because the company reported no spending on equipment, buildings, or leases.
What does an investor pay for F&C today?
Price to book is closer to the useful question because it compares the market price with recorded net assets. Free-cash-flow yields are also poor guides when buying and selling investments dominates cash movements. Dividends are more tangible: the 2025 dividend was covered by revenue, and the reserve helps support payments when investment income weakens.
| Today (Oct 28, 2026) | |
|---|---|
| Share price | 341.60 |
| P/E, last 12 months (calculated) | 4.5x |
| Price to book (calculated) | 0.9x |
| Real free cash flow yield (calculated) | 0.9% |
| Dividend yield (calculated) | 1.2% |
What this means. The price-to-earnings number appears to use investment returns including share-price gains, rather than just the company's profit, so it may not be a normal price-to-earnings measure.