VINCI stock forecast 2027–2029
MyStockButler's October 2026 analysis: VINCI's weighted forecast reaches €124.23 in October 2029, with 52% assigned to the base case. It hinges on cash generation after tax, investment and concession obligations.
Where could VINCI's shares go?
The probability-weighted share price is €105.36 in October 2027, implying a 4% return from €106.45 today after including dividends. It rises to €114.17 in October 2028, or 17%, and €124.23 in October 2029, or 32%. The 2029 range is wide: €80.75 in the bear case to €168.13 in the bull case. The probabilities are 28% bear, 52% base and 20% bull.
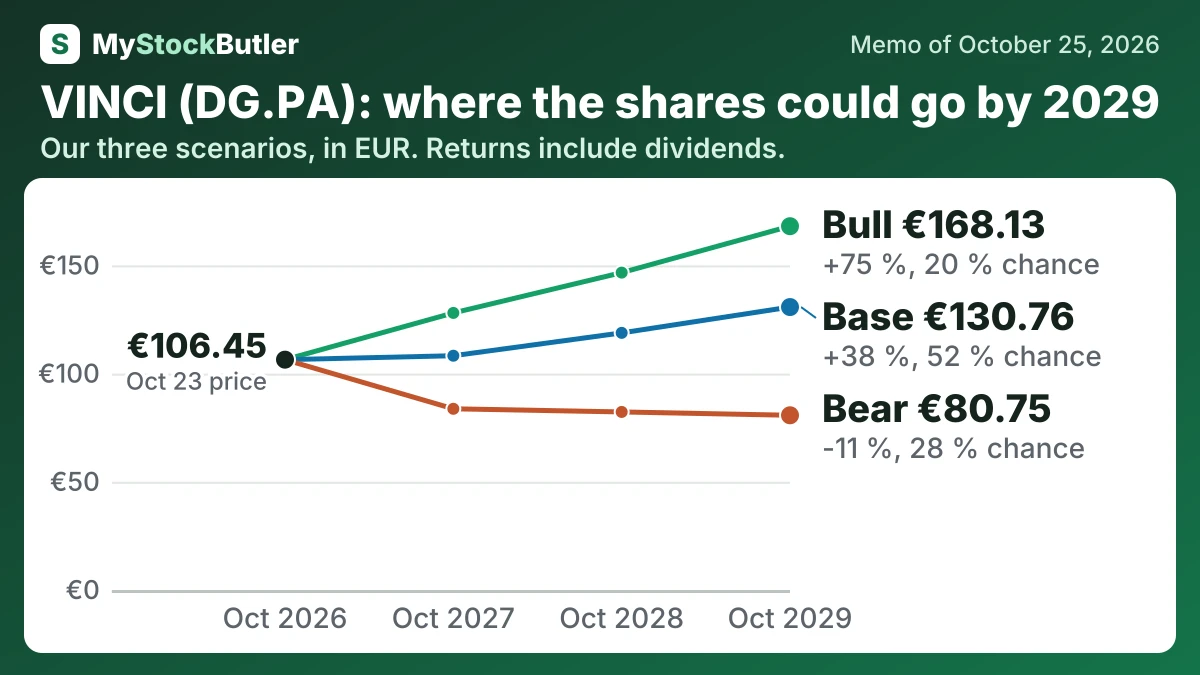
| Case | Probability | October 2027 | October 2028 | October 2029 |
|---|---|---|---|---|
| Bear | 28 % | 83.74 (-17 %) | 82.29 (-14 %) | 80.75 (-11 %) |
| Base | 52 % | 108.27 (+7 %) | 118.83 (+22 %) | 130.76 (+38 %) |
| Bull | 20 % | 128.05 (+25 %) | 146.68 (+49 %) | 168.13 (+75 %) |
| Weighted | 100 % | 105.36 (+4 %) | 114.17 (+17 %) | 124.23 (+32 %) |
What has to go right for VINCI, and what could go wrong?
Net asset value rises in the base case because earnings retained after dividends and buybacks exceed the pressure from tax and investment. The table sets the base path at €32,130m in October 2027, then higher levels in the following two years. The bear path ends at €31,130m because weaker earnings, tax, execution losses and impairments overwhelm retention. The bull path reaches €38,670m as Energy Solutions, concessions and renewables generate stronger earnings. VINCI's equity increased every year from 2021 through 2025, while 2025 net income was €4,903m. The €6,000m 2026 free-cash-flow target supports the base case, but €900m of Zero.e capital expenditure and the proposed €450m tax charge limit confidence.
How much cash does VINCI really make?
Cash from operations was €11.886 billion in 2025. After capital spending, the accompanying calculation left €8.004 billion; after employee stock compensation, it left €7.437 billion. VINCI’s own measure was different because its bridge treats concession investment, disposals, leases and growth spending differently. Neither label is meaningful until its deductions are understood.
| 2025 | 2024 | 2023 | 2022 | 2021 | |
|---|---|---|---|---|---|
| Cash from operations | 11,886 | 11,714 | 10,540 | 9,387 | 7,806 |
| − Capital spending | 3,011 | 2,878 | 2,251 | 2,621 | 1,214 |
| − Lease payments | 871 | 745 | 679 | 661 | 631 |
| − Interest paid | 0 | 0 | 0 | 0 | 0 |
| = Free cash flow | 8,004 | 8,091 | 7,610 | 6,105 | 5,961 |
| = Real free cash flow | 7,437 | 7,629 | 7,250 | 5,749 | 5,673 |
What this means. The company's own free cash flow is lower because its rules subtract extra cash items that we do not subtract.
What does an investor pay for VINCI today?
At €106.45 on 25 October 2026, the trailing P/E, or price-to-earnings ratio, is 11.8x. It means investors pay €11.80 for each euro of profit earned over the last twelve months. The forward P/E is 10.7x because it uses estimated earnings for the next twelve months. With the share price unchanged, that implies roughly 10% earnings-per-share growth. The expectation could come from higher profit, fewer shares, or both. The French 10-year government bond yield was 5.05%, providing a useful comparison for the return investors demand from a riskier share.
The headline free-cash-flow yield is 13.6%, while the separately stated real free-cash-flow yield is 12.7%. A yield is not a promised distribution: VINCI can direct cash to dividends, buybacks, acquisitions or debt reduction. Its value depends on what remains after those competing demands.
| Today (Oct 25, 2026) | |
|---|---|
| Share price | 106.45 |
| Market value (calculated) | 58,712 |
| Enterprise value (calculated) | 80,263 |
| P/E, last 12 months (calculated) | 11.8x |
| Free cash flow yield (calculated) | 13.6% |
| Real free cash flow yield (calculated) | 12.7% |
What this means. Enterprise value is higher than market value because it includes the company's debt after subtracting its cash, showing what it would cost to buy the whole business.