CoStar stock forecast 2027–2029
MyStockButler's October 2026 analysis: The weighted price is $27.78 in October 2027, with bear, base and bull probabilities of 30%, 55% and 15%. It hinges on bookings recovering, Homes.com monetizing its audience and acquisitions adding profitable growth.
Where could CoStar's shares be by 2029?
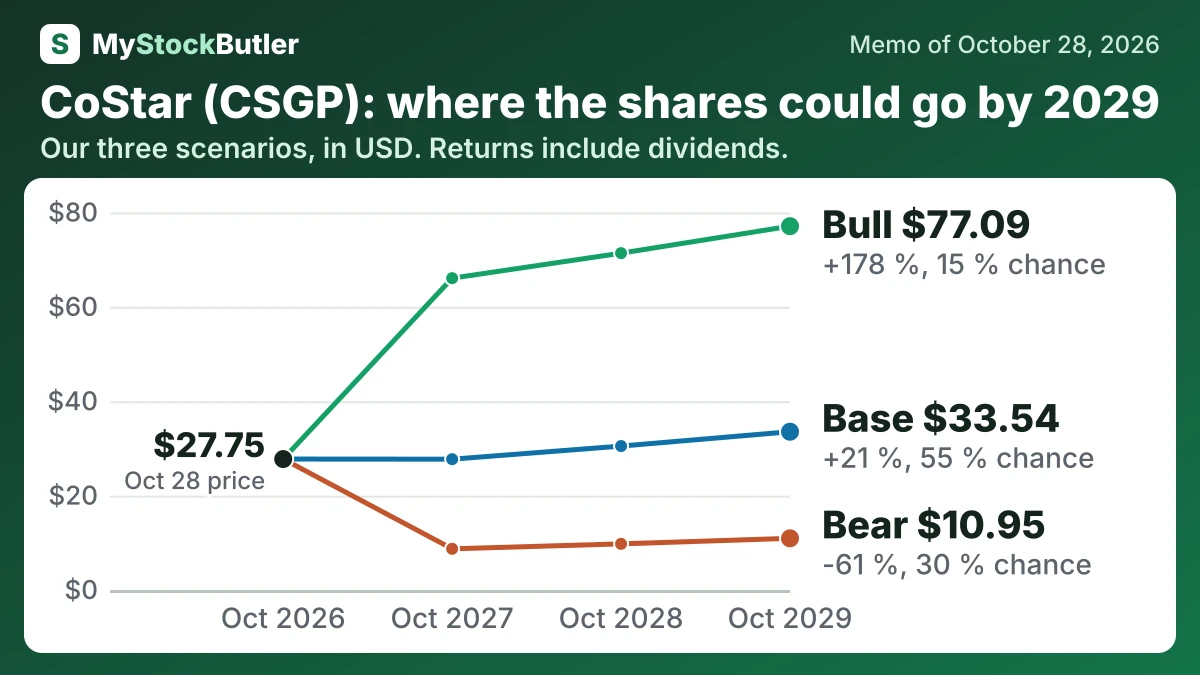
The weighted price is $27.78 in October 2027. That implies a 0% return. It reaches $33.30 in October 2029. That implies a 20% return. The bear case has 30% probability; the base case has 55%; the bull case has 15%.
| Case | Probability | October 2027 | October 2028 | October 2029 |
|---|---|---|---|---|
| Bear | 30 % | 8.73 (-69 %) | 9.78 (-65 %) | 10.95 (-61 %) |
| Base | 55 % | 27.72 (-0 %) | 30.50 (+10 %) | 33.54 (+21 %) |
| Bull | 15 % | 66.08 (+138 %) | 71.38 (+157 %) | 77.09 (+178 %) |
| Weighted | 100 % | 27.78 (+0 %) | 30.41 (+10 %) | 33.30 (+20 %) |
What has to go right or wrong for CoStar?
The base case reaches $1,060 million of FY2030 EBIT. It starts with FY2026 revenue of $3,760 million and assumes 9% annual growth, producing about $5,308 million by FY2030. A 20% EBIT margin then gives the selected result. This assumes gradual booking recovery, continued commercial subscription growth and Homes.com approaching break-even, while amortization, stock compensation and investment keep EBIT below adjusted EBITDA.
The bear case gives $550 million of EBIT. It assumes 5% annual revenue growth and a 12% margin, because Q3 annualized net new bookings fell to $37 million from $84 million a year earlier and customer payback remains undisclosed. The bull case gives $1,540 million. It assumes 12% growth and a 26% margin, requiring bookings to rebound, Homes.com to convert traffic into renewing paid agents and acquisitions to add operating leverage.
| FY2030 | |
|---|---|
| Operating profit (EBIT) | 1,060 (550 / 1,540) |
| Shares (millions) | 394 (412 / 368) |
| Exit multiple (enterprise value to operating profit (ebit)) | 14.00 (10.00 / 20.00) |
| Net debt | 54.00 (340 / -285) |
What this means. The exit multiple says how many dollars investors may pay for each dollar of yearly operating profit, so a higher number assumes the company will be valued more richly.
How much cash does CoStar really make?
Free cash flow subtracts capital spending from operating cash. CoStar spent $307 million on campuses and $82 million on other property and equipment in 2025, leaving much less cash than operating activities alone suggest. The accompanying “real free cash flow” measure goes further by subtracting stock compensation. That is an economic warning about dilution, not a second cash payment.
| 2025 | 2024 | 2023 | 2022 | 2021 | |
|---|---|---|---|---|---|
| Cash from operations | 430 | 393 | 490 | 478.7 | 469.7 |
| − Capital spending | 389 | 638 | 143 | 93.8 | 188.9 |
| = Free cash flow | 41 | -245 | 347 | 384.9 | 280.8 |
| − Stock pay | 194 | 89 | 85 | 75.2 | 63.7 |
| = Real free cash flow | -153 | -334 | 262 | 309.7 | 217.1 |
| Real free cash flow, % of revenue | -4.7% | -12.2% | 10.7% | 14.2% | 11.2% |
What this means. Stock pay uses no cash today, but it gives employees part of the company, so we subtract it to show what is truly left for shareholders.
What does an investor pay for CoStar today?
The valuation is forecast-sensitive: trailing P/E is 63.1x, while next-twelve-month P/E is 15.9x. CoStar’s free cash flow yield is 0.4%, while its real free cash flow yield is -1.4%. In 2025, operating margin was -2.2%. Real free cash flow was -4.7% of revenue. CoStar’s diluted EPS was $0.02 in 2025. Real free cash flow after stock pay was -$0.36 per share. Buybacks were $1.19 per share, while average diluted shares increased 3.2%.