CDW stock forecast 2027–2029
MyStockButler's October 2026 analysis: CDW's weighted case points to $201.91 by October 2027 and $237.54 by October 2029. It hinges on profitable growth, better cash conversion and disciplined capital returns.
Where could CDW's shares go in the forecast?
The weighted case points to $201.91 by October 2027 and $237.54 by October 2029, hinging on profitable growth, better cash conversion and disciplined capital returns. Those outcomes include a 24% return at the first date and a 49% return at the last.
The forecast assigns 30% probability to the bear case and 52% to the base case. The bull case has 18%. The thesis needs sales growth to produce gross profit, inventory to turn into collections, and Lovelytics—the company CDW acquired—to show retention and follow-on work.
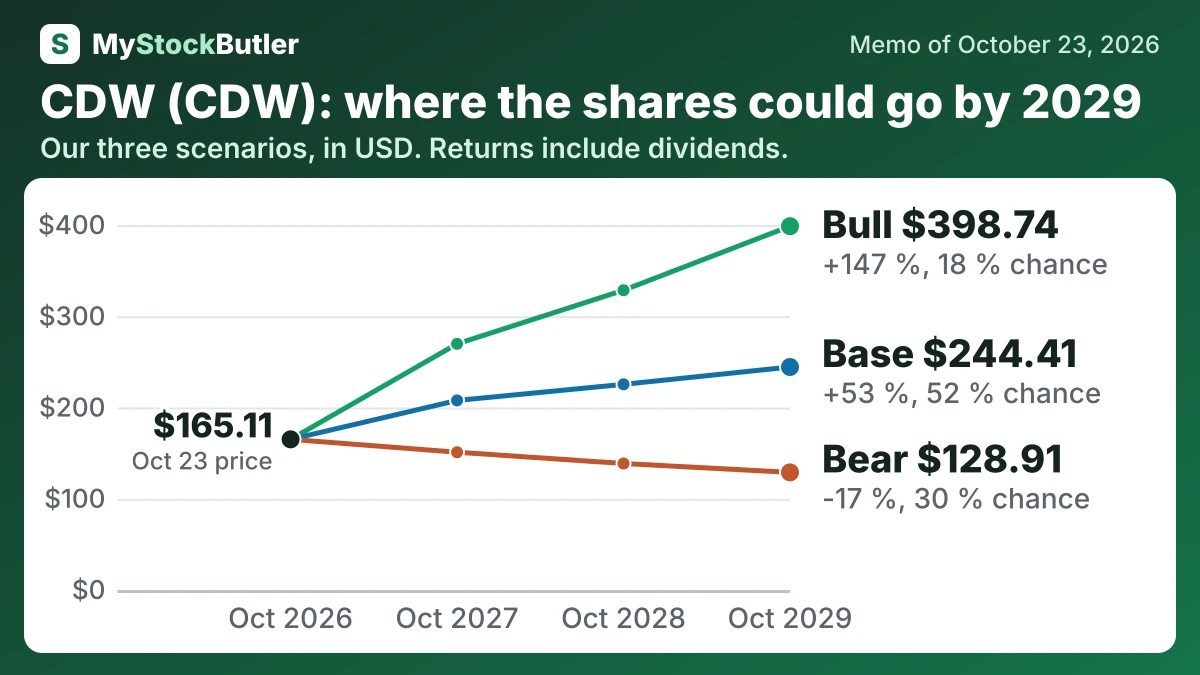
| Case | Probability | October 2027 | October 2028 | October 2029 |
|---|---|---|---|---|
| Bear | 30 % | 150.98 (-7 %) | 138.61 (-13 %) | 128.91 (-17 %) |
| Base | 52 % | 207.78 (+27 %) | 225.42 (+40 %) | 244.41 (+53 %) |
| Bull | 18 % | 269.81 (+65 %) | 328.54 (+102 %) | 398.74 (+147 %) |
| Weighted | 100 % | 201.91 (+24 %) | 217.94 (+35 %) | 237.54 (+49 %) |
What has to go right—and what could go wrong for CDW?
The bear case ends at $1,186M. It assumes revenue grows only from $23,800M to $24,200M and margins fall from 5.2% to 4.9%. The bull case ends at $1,796M, using revenue from $24,700M to $28,500M and margins from 5.9% to 6.3%. The difference reflects the latest warning sign: second-quarter revenue grew 10.0%, but gross profit grew only 6.3%, while gross margin fell to 20.1%.
How much cash does CDW really make?
Stock compensation creates another gap between cash and economic cost. Accounting adds it back because issuing shares is not an immediate cash payment. An analyst can deduct it again to estimate “real” free cash flow, recognising that employees received value belonging to shareholders.
| 2025 | 2024 | 2023 | 2022 | 2021 | |
|---|---|---|---|---|---|
| Cash from operations | 1,205.2 | 1,277.3 | 1,598.7 | 1,335.9 | 784.6 |
| − Capital spending | 117.1 | 122.6 | 148.2 | 127.8 | 100.0 |
| = Free cash flow | 1,088.1 | 1,154.7 | 1,450.5 | 1,208.1 | 684.6 |
| − Stock pay | 83.6 | 64.7 | 93.7 | 91.1 | 72.6 |
| = Real free cash flow | 1,004.5 | 1,090.0 | 1,356.8 | 1,117.0 | 612.0 |
| Real free cash flow, % of revenue | 4.5% | 5.2% | 6.3% | 4.7% | 2.9% |
What this means. The company's own free cash flow differs from ours because it adds back some financing cash and subtracts other financing cash, while our count includes those cash movements.
What does an investor pay for CDW today?
At $165.11 on October 23, 2026, investors pay 19.8 times CDW’s last twelve months’ earnings. P/E means the share price divided by earnings per share: it shows how much investors pay for each dollar of annual profit. The forward P/E is 15.1 times because it uses expected earnings instead. That lower figure helps only if the forecast is realistic and uses the same accounting basis.
| Today (Oct 23, 2026) | |
|---|---|
| Share price | 165.11 |
| Enterprise value (calculated) | 26,096.8 |
| P/E, last 12 months (calculated) | 19.8x |
| P/E, next 12 months (calculated) | 15.1x |
| Free cash flow yield (calculated) | 5.3% |
| Real free cash flow yield (calculated) | 4.9% |
What this means. Enterprise value is higher than market value because it includes the company's debt after subtracting its cash.