CDW earnings date
MyStockButler's October 2026 analysis: CDW's next results are expected on November 4, 2026. Watch whether CDW turns stronger sales into gross profit and cash.
What has CDW guided for 2026?
For 2026, management targets customer-spend growth 200–300 basis points above U.S. IT market growth and adjusted EPS growth at the high end of the high-single-digit range. It also targets adjusted free cash flow at 80%–90% of non-GAAP net income and net leverage of 2.0x–3.0x.
| Period guided | Low | High | Date given | |
|---|---|---|---|---|
| U.S. IT growth plus a premium target (basis points) | Year to Dec 2026 | 200 | 300 | Aug 5, 2026 |
| GROSS PROFIT | Year to Dec 2026 | Aug 5, 2026 | ||
| NON-GAAP NET INCOME PER DILUTED SHARE | Year to Dec 2026 | Aug 5, 2026 | ||
| Annual adjusted free cash flow (% of Non-GAAP net income) | Year to Dec 2026 | 80.0% | 90.0% | Aug 5, 2026 |
| Target Net Leverage Ratio | Year to Dec 2026 | 2.0x | 3.0x | Aug 5, 2026 |
| Dividend per share annually | Year to Dec 2026 | 2.52 | 2.52 | Aug 5, 2026 |
What this means. The blank rows do not mean guidance is missing; the company gave those expectations in words instead of exact numbers.
Has CDW kept its past promises?
The record earns a mixed assessment. Adjusted EPS growth beat its original outlook in three of the five years checked and missed in two. Tax assumptions were more dependable, while interest expense was less predictable. Acquisition financing helps explain the interest overrun in 2021, but not the later earnings misses.
| What management forecast | Checked | Above | Within | Below |
|---|---|---|---|---|
| Non-GAAP Earnings Per Diluted Share Growth | 5 years | 3 | 0 | 2 |
| Annual interest expense | 5 years | 2 | 1 | 2 |
| Non-GAAP effective tax rate | 5 years | 0 | 3 | 2 |
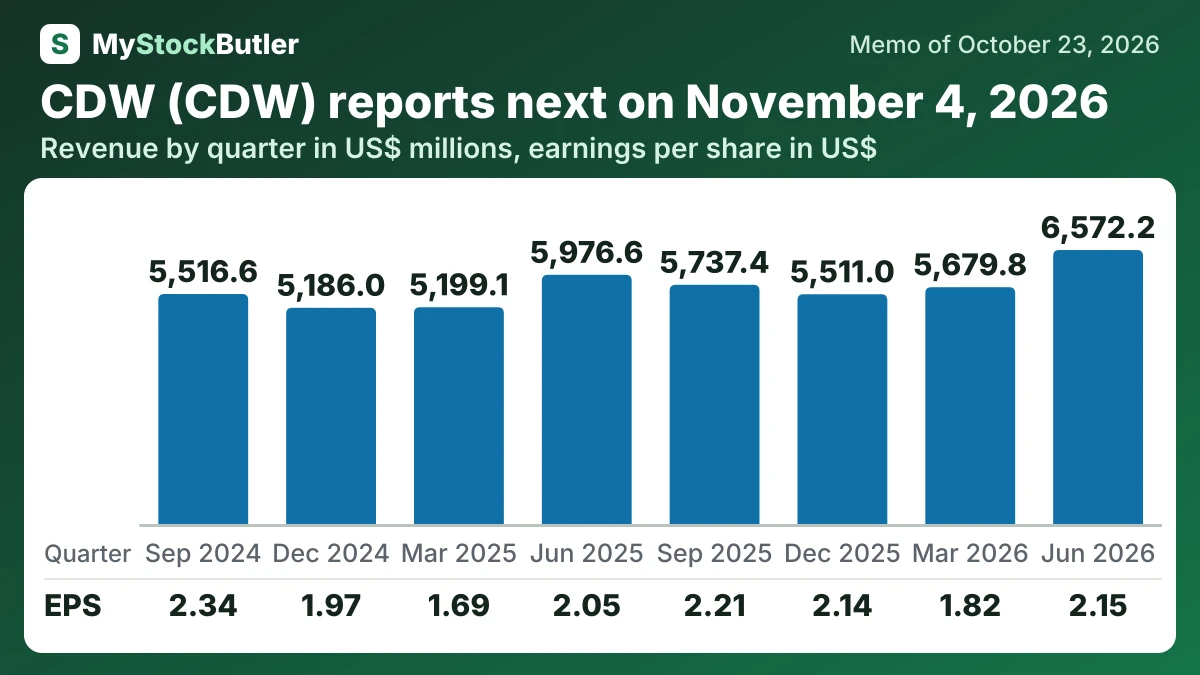
What have CDW's last eight quarters shown?
Revenue rose 6.8% in 2025, but sales remained below that earlier high. The five-year record also contains an acquisition, a retreat in customer hardware spending and a later rebound, so it does not describe one steady underlying growth rate.
In 2025, revenue grew 6.8%, while gross profit grew 5.9%. Gross margin slipped from 21.9% to 21.7%. Selling and administrative expense grew faster than gross profit, so operating income barely moved and net income fell.
| Jun 2026 | Mar 2026 | Dec 2025 | Sep 2025 | Jun 2025 | Mar 2025 | Dec 2024 | Sep 2024 | |
|---|---|---|---|---|---|---|---|---|
| Revenue | 6,572.2 | 5,679.8 | 5,511.0 | 5,737.4 | 5,976.6 | 5,199.1 | 5,186.0 | 5,516.6 |
| Gross margin | 20.1% | 21.0% | 22.8% | 21.9% | 20.8% | 21.6% | 22.3% | 21.8% |
| Operating income | 428.6 | 376.0 | 430.7 | 443.3 | 420.2 | 361.4 | 408.6 | 481.6 |
| Net income | 274.4 | 235.4 | 279.5 | 291.0 | 271.2 | 224.9 | 264.2 | 316.4 |
| EPS, diluted | 2.15 | 1.82 | 2.14 | 2.21 | 2.05 | 1.69 | 1.97 | 2.34 |
| = Free cash flow | -82.6 | 248.4 | 395.9 | 298.5 | 133.4 | 260.3 | 316.7 | 308.5 |
What this means. Free cash flow is negative in June 2026 because the company’s daily business used cash and it also spent money on equipment.
What should I watch in CDW's next results?
CDW reports third-quarter results on November 4, 2026. The key signs are gross profit keeping pace with the outlook, operating expenses falling relative to the business generated, and inventory turning into collections. Higher sales followed by another cash shortfall would make borrowing or slower repurchases more likely.