Bloom Energy stock forecast 2027–2029
MyStockButler's October 2026 analysis: Bloom Energy's weighted forecast is $75.82 in October 2027 and $94.06 in October 2029; the bear case has 30% probability, the base case 55%, and the bull case 15%. It hinges on project conversion, durable margins, cash generation and dilution.
Where could Bloom Energy's shares be by 2029?
The weighted price is $75.82 in October 2027. That is a 65% loss. The weighted price is $94.06 in October 2029. That is a 57% loss. The bear case has 30% probability. The base case has 55%; the bull case has 15%.
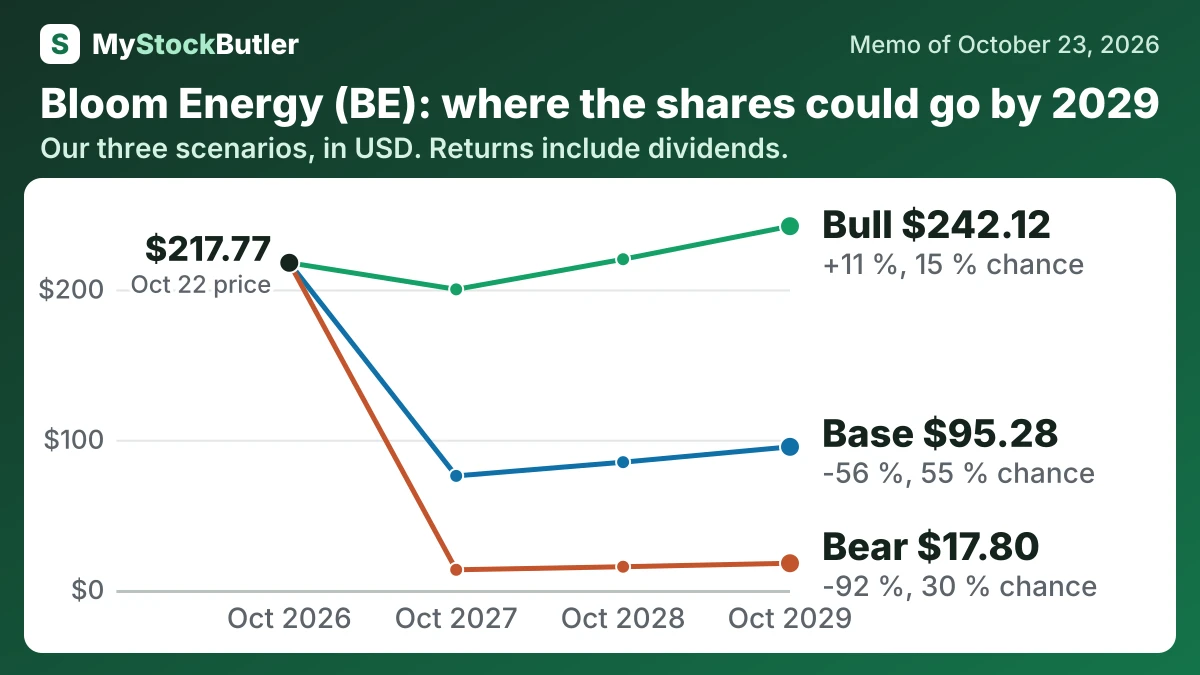
| Case | Probability | October 2027 | October 2028 | October 2029 |
|---|---|---|---|---|
| Bear | 30 % | 13.45 (-94 %) | 15.48 (-93 %) | 17.80 (-92 %) |
| Base | 55 % | 75.94 (-65 %) | 85.08 (-61 %) | 95.28 (-56 %) |
| Bull | 15 % | 200.08 (-8 %) | 220.13 (+1 %) | 242.12 (+11 %) |
| Weighted | 100 % | 75.82 (-65 %) | 84.45 (-61 %) | 94.06 (-57 %) |
What has to go right or wrong for Bloom Energy?
The bear case gives EBIT of $480 million on $6.0 billion of revenue and an 8% margin. Delayed sites, fuel constraints and weak utilization keep growth near the low end. The bull case reaches $2,800 million on $14.0 billion of revenue and a 20% margin, requiring factory expansion, rapid project conversion and sustained product margins. The latest quarter supports the direction, but the positive EBIT record remains brief.
How much cash does Bloom Energy really make?
Cash from operations was $113.9 million in 2025. Capital spending was $56.8 million, leaving free cash flow of $57.2 million, or 2.8% of revenue. That was a recovery from the heavy outflows of earlier years, although the five-year total still showed a $785.0 million outflow.
Stock compensation changes the ownership economics. Bloom added $139.4 million of stock pay back to operating cash flow because no cash left immediately. Deducting it produces analytical “real free cash flow” of negative $82.2 million, or negative 4.1% of revenue. This is not a GAAP subtotal; it asks whether the cash return remains attractive after paying employees with shares.
| 2025 | 2024 | 2023 | 2022 | 2021 | |
|---|---|---|---|---|---|
| Cash from operations | 113,949 | 91,998 | -372,531 | -191,723 | -60,681 |
| Of which, tied up in working capital | 217,285 | 73,438 | 440,362 | 186,842 | 18,924 |
| − Capital spending | 56,759 | 58,852 | 83,739 | 116,823 | 49,810 |
| = Free cash flow | 57,190 | 33,146 | -456,270 | -308,546 | -110,491 |
| − Stock pay | 139,406 | 82,424 | 84,480 | 112,259 | 73,274 |
| = Real free cash flow | -82,216 | -49,278 | -540,750 | -420,805 | -183,765 |
| Free cash flow, % of revenue | 2.8% | 2.2% | -34.2% | -25.7% | -11.4% |
| Real free cash flow, % of revenue | -4.1% | -3.3% | -40.6% | -35.1% | -18.9% |
What does an investor pay for Bloom Energy today?
The tables show revenue rose to $2.02 billion in 2025 as operating margin recovered to 3.6%. Bloom’s own real free cash flow remained negative 4.1% of revenue. At $217.77, trailing P/E was 133.6x; next-twelve-month P/E was 43.1x. Net debt fell to $412.8 million. Stock-based pay was $0.58 per share against the company’s free cash flow of $0.24 per share.
| Today (Oct 23, 2026) | |
|---|---|
| Share price | 217.77 |
| Market value (calculated) | 64,385,157.16 |
| Enterprise value (calculated) | 64,564,518.16 |
| P/E, last 12 months (calculated) | 133.6x |
| P/E, next 12 months (calculated) | 43.1x |
| EV / revenue, last 12 months (calculated) | 16.9x |
| Price to book (calculated) | 33.3x |
| Free cash flow yield (calculated) | 0.1% |
| Real free cash flow yield (calculated) | -0.1% |
| Dividend yield (calculated) | 0.0% |