Baxter International stock forecast 2027–2029
MyStockButler's October 2026 analysis: Baxter International's weighted price is $22.19 in October 2027. It hinges on whether reliable supply and better utilization lift margins.
Where could Baxter International's shares be by 2029?
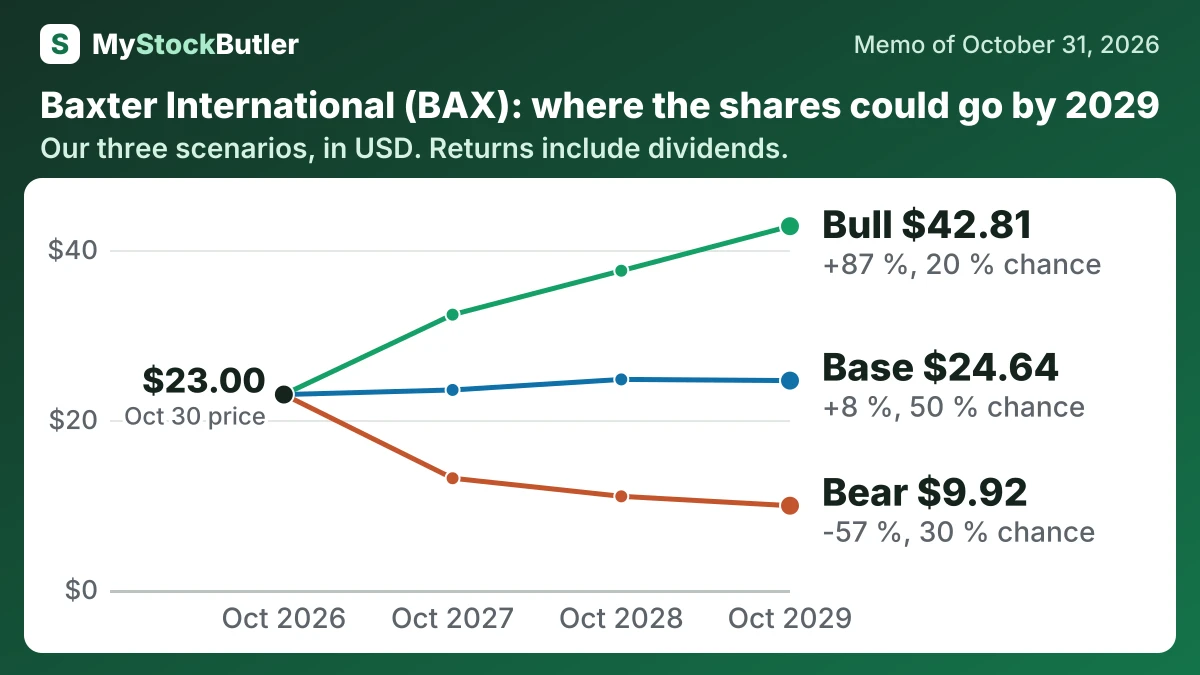
Our weighted price is $22.19 in October 2027. That is a 3% loss including dividends. It reaches $23.86 in October 2029. That is a 4% gain including dividends. Bear probability is 30%. Base probability is 50%, and bull probability is 20%.
| Case | Probability | October 2027 | October 2028 | October 2029 |
|---|---|---|---|---|
| Bear | 30 % | 13.15 (-43 %) | 11.02 (-52 %) | 9.92 (-57 %) |
| Base | 50 % | 23.54 (+3 %) | 24.78 (+8 %) | 24.64 (+8 %) |
| Bull | 20 % | 32.40 (+41 %) | 37.57 (+64 %) | 42.81 (+87 %) |
| Weighted | 100 % | 22.19 (-3 %) | 23.21 (+1 %) | 23.86 (+4 %) |
What this means. The weighted row is the average value after giving each case its stated chance, so it can be below today's price even when the base and bull cases are above it.
What has to go right for Baxter International, and what could go wrong?
The bear case falls from $853 million to $796 million because weak fluid demand, injectable price pressure, pump restrictions and Round Lake costs keep margins near 7%. The bull case rises from $1,196 million to $1,380 million because reliable supply, broader pump deployment and better utilization lift margins. The bear reflects visible operating risks and a 2/5 guidance record; the bull requires several improvements to succeed together.
How much cash does Baxter International really make?
In 2025, sales rose 5.7%, but operating income was a $308 million loss. The company’s own free cash flow was $438 million. After $117 million of stock pay, cash from operations less capital spending left $321 million of computed real free cash flow. Net debt fell from $11.36 billion to $7.51 billion after the Kidney Care sale. Investors still worry about lower IV-fluid demand, the Novum pump hold, Round Lake quality problems and the end of Vantive support payments.
| 2025 | 2024 | 2023 | 2022 | |
|---|---|---|---|---|
| Cash from operations | 951 | 819 | 1,207 | 528 |
| − Capital spending | 513 | 446 | 432 | 377 |
| = Free cash flow | 438 | 373 | 775 | 151 |
| − Stock pay | 117 | 114 | 115 | 140 |
| = Real free cash flow | 321 | 259 | 660 | 11 |
What this means. Real free cash flow is lower because we subtract shares given to employees as pay, even though no cash was paid, because those shares reduce existing owners’ share of the company.
What does Baxter International's stock price imply about earnings and cash?
The forward P/E is 11.1 times expected earnings for the next 12 months. At $23.00, that multiple implies roughly $2.07 of earnings per share, even though Baxter reported a 2025 continuing-operations loss of $1.75 per share. Special items reduced that result by $4.02 per share, so investors must decide whether restructuring, remediation and impairment costs will truly fade.
Free cash flow tests that assumption. It is operating cash after spending on factories and equipment. In the first nine months of 2026, Baxter generated $1.068 billion from continuing operations and spent $363 million on capital projects. That left $705 million, which can repay debt, fund repairs or support dividends.
| Today (Oct 31, 2026) | |
|---|---|
| Share price | 23.00 |
| Enterprise value (calculated) | 18,525.01 |
| P/E, next 12 months (calculated) | 11.1x |
| Free cash flow yield (calculated) | 3.7% |
| Real free cash flow yield (calculated) | 2.7% |
| Dividend yield (calculated) | 0.2% |
What this means. The last-12-month price-to-earnings measure is not meaningful because the company lost money during that period.