GE HealthCare stock forecast 2027–2029
MyStockButler's October 2026 analysis: GE HealthCare's weighted forecast is $79.58 by October 2027, with bear, base and bull probabilities of 30%, 50% and 20%. It hinges on whether Patient Care Solutions recovers, China pricing holds and cash conversion improves.
Where could GE HealthCare's shares be by October 2029?
The weighted forecast is $79.58 by October 2027, a +14% return. It is $100.55 by October 2029, a +44% return. Bear, base and bull probabilities are 30%, 50% and 20%.
The range is wide because the outcome depends on Patient Care Solutions, China pricing, cash conversion and the valuation investors assign to recovery. By October 2029, the bear case gives $48.87 and the bull case gives $163.98, against today’s $70.24.
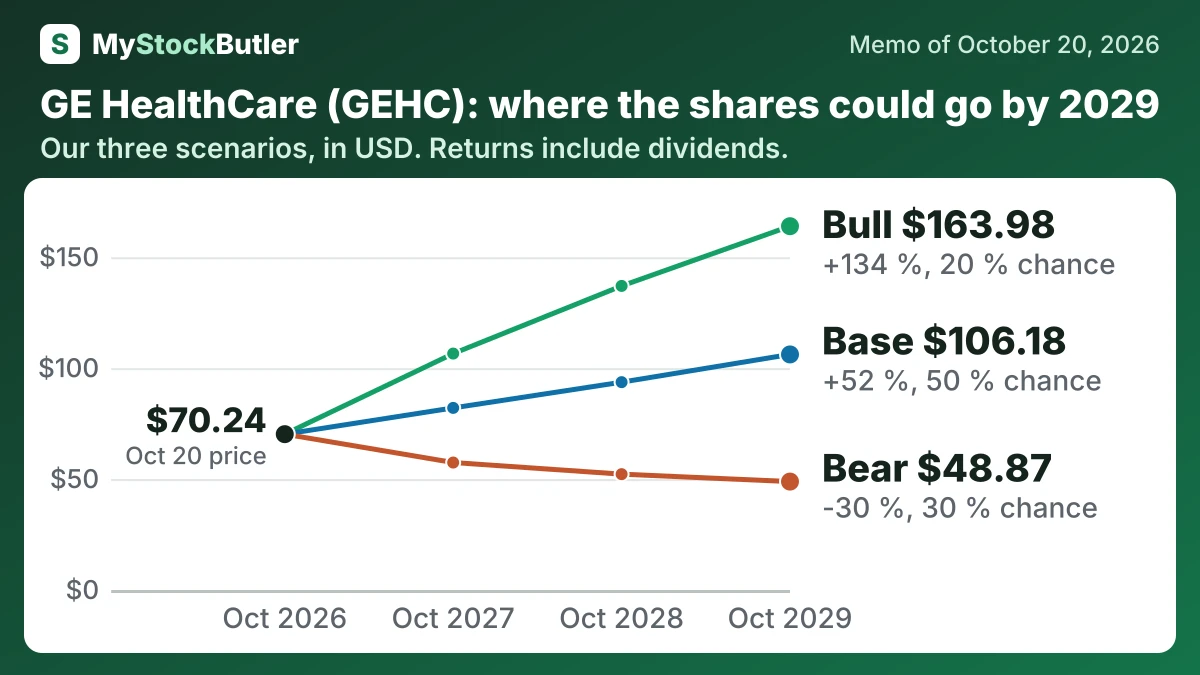
| Case | Probability | October 2027 | October 2028 | October 2029 |
|---|---|---|---|---|
| Bear | 30 % | 57.45 (-18 %) | 52.21 (-25 %) | 48.87 (-30 %) |
| Base | 50 % | 82.08 (+17 %) | 93.68 (+34 %) | 106.18 (+52 %) |
| Bull | 20 % | 106.56 (+52 %) | 137.06 (+96 %) | 163.98 (+134 %) |
| Weighted | 100 % | 79.58 (+14 %) | 89.91 (+28 %) | 100.55 (+44 %) |
What has to go right, and what could go wrong for GE HealthCare?
The base path reflects reaffirmed 2026 adjusted EPS guidance of $4.80–$5.00, imaging orders converting, gradual Patient Care Solutions recovery and service growth. Service revenue grew 5.6% in 2025, while Pharmaceutical Diagnostics grew 14.6% organically in the June quarter. The bear case reflects China revenue falling 0.6%, PCS revenue falling 13.5% organically and a $26 million PCS segment loss. The bull case requires those problems to reverse and margins to expand.
The bear case requires China procurement pressure and local competition to keep equipment prices weak while PCS fulfillment problems persist. Revenue stays below plan, margins contract and weak cash conversion prevents buybacks. It gives $57.45 by October 2027 and $48.87 by October 2029. Its probability is 30% because PCS losses, China weakness and low first-half cash flow are already visible, although service and diagnostics cushion the downside.
How much cash does GE HealthCare really make?
Operating cash flow was $1,987 million in 2025, against net income of $2,084 million. Capital spending of $482 million left $1,505 million of free cash flow. Free cash flow is operating cash after investment in factories, equipment and capitalized software, so it is the cash available for debt repayment, dividends, acquisitions or shareholder returns.
| 2025 | 2024 | 2023 | 2022 | 2021 | |
|---|---|---|---|---|---|
| Cash from operations | 1,987 | 1,955 | 2,101 | 2,134 | 1,607 |
| − Capital spending | 482 | 401 | 387 | 310 | 248 |
| = Free cash flow | 1,505 | 1,554 | 1,714 | 1,824 | 1,359 |
| − Stock pay | 130 | 125 | 114 | 67 | 76 |
| = Real free cash flow | 1,375 | 1,429 | 1,600 | 1,757 | 1,283 |
| Real free cash flow, % of revenue | 6.7% | 7.3% | 8.2% | 9.6% | 7.3% |
What does an investor pay today for GE HealthCare?
| Today (Oct 20, 2026) | |
|---|---|
| Share price | 70.24 |
| P/E, last 12 months (calculated) | 16.1x |
| P/E, next 12 months (calculated) | 12.9x |
| Free cash flow yield (calculated) | 4.7% |
| Real free cash flow yield (calculated) | 4.3% |