BASF stock forecast 2027–2029
MyStockButler's October 2026 analysis: Our weighted forecast is €26.65 in October 2027, with bear, base, and bull probabilities of 30%, 50%, and 20%. It hinges on Zhanjiang’s path to positive earnings.
Where could BASF's shares be by 2029?
Our weighted forecast is €26.65 in October 2027, a 46% negative return including dividends, and €40.99 in October 2029, an 11% negative return including dividends. Bear, base, and bull probabilities are 30%, 50%, and 20%.
The probability-weighted price is €26.65 in October 2027, a negative return of 46% including dividends. It rises to €33.26 in October 2028, still a negative 30% return. By October 2029, it reaches €40.99, implying a negative 11% return.
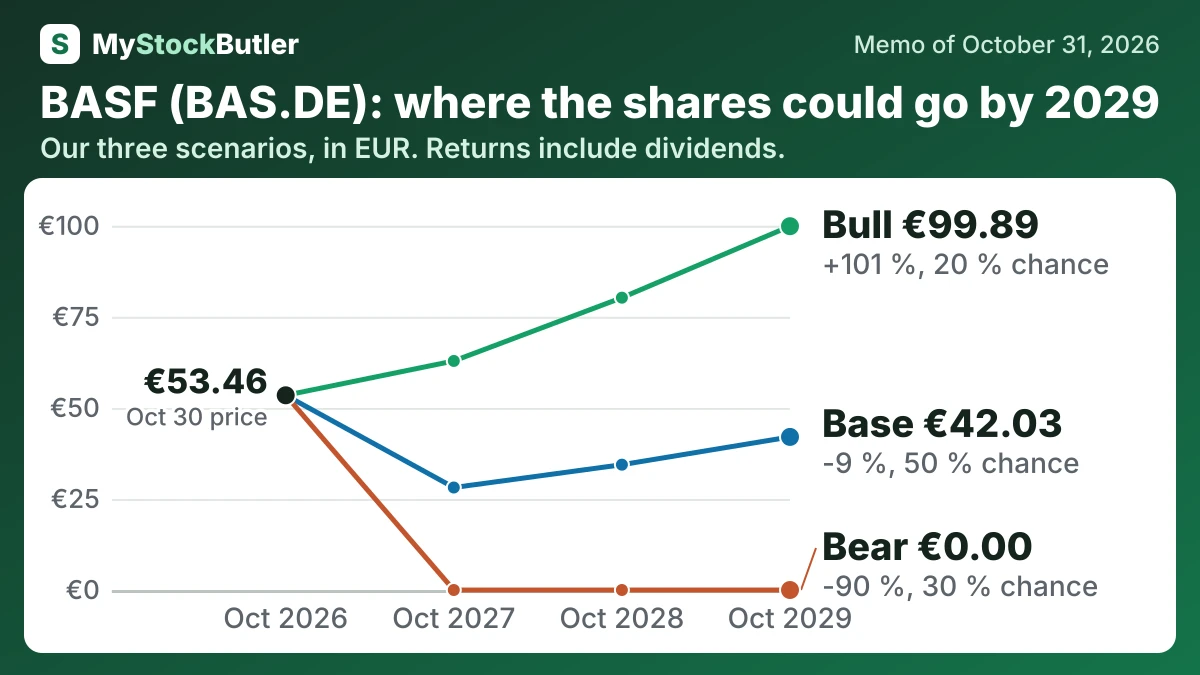
| Case | Probability | October 2027 | October 2028 | October 2029 |
|---|---|---|---|---|
| Bear | 30 % | 0.00 (-96 %) | 0.00 (-92 %) | 0.00 (-90 %) |
| Base | 50 % | 28.14 (-43 %) | 34.41 (-27 %) | 42.03 (-9 %) |
| Bull | 20 % | 62.89 (+22 %) | 80.26 (+59 %) | 99.89 (+101 %) |
| Weighted | 100 % | 26.65 (-46 %) | 33.26 (-30 %) | 40.99 (-11 %) |
What has to go right for BASF?
Normal operating profit rises from €3.0 billion in the base case to €3.6 billion by 2029. The bear path rises from €1.9 billion to €2.3 billion, while the bull path rises from €4.1 billion to €5.1 billion. The base assumes sales of about €60 billion initially and €62 billion later, with margins moving from 5% to 5.8%. This starts near 2025 adjusted operating income of €2.887 billion and allows Zhanjiang to improve gradually. The bear reflects oversupply and weak European competitiveness; the bull requires stronger spreads, utilization and profitable Zhanjiang operations.
| October 2027 | October 2028 | October 2029 | |
|---|---|---|---|
| Normal operating profit | 3,000 (1,900 / 4,100) | 3,300 (2,100 / 4,600) | 3,600 (2,300 / 5,100) |
| Shares (millions) | 835 (843 / 823) | 818 (835 / 818) | 818 (835 / 807) |
| Dividends per share | 2.25 (2.25 / 2.25) | 2.25 (1.80 / 2.50) | 2.25 (1.50 / 2.75) |
| Enterprise value to normal operating profit | 14.00 (10.00 / 17.00) | 14.50 (9.00 / 18.00) | 15.00 (9.00 / 19.00) |
| Net debt | 18,510 (19,936 / 17,964) | 19,702 (22,530 / 17,158) | 19,616 (24,548 / 16,302) |
How much cash does BASF really make?
Free cash flow is operating cash flow less spending on property, plants, and intangible assets. BASF reported €1.3 billion in 2025, up from €748 million in 2024, mainly because investment payments fell. These company-wide figures include Coatings as a discontinued operation, while the continuing operating-cash figures above exclude it, so the scopes must not be mixed.
EBITDA helps compare businesses before interest, tax, depreciation and amortization, but it is not cash available to spend: plants still need repairs and replacement. BASF’s enterprise value divided by the midpoint of its 2026 EBITDA-before-special-items forecast gives about 8.2 times, below the 9.5-times European chemical median at September 30, 2026. Free cash flow is the harder test: BASF generated €1.342 billion in 2025 but negative €1.040 billion in the first nine months of 2026, when working capital absorbed €4.112 billion.
| Sep 2026 | Jun 2026 | Mar 2026 | Dec 2025 | Sep 2025 | Jun 2025 | Mar 2025 | Dec 2024 | |
|---|---|---|---|---|---|---|---|---|
| Cash from operations | 1,096 | |||||||
| − Capital spending | 572 | |||||||
| − Interest paid | 0 | 0 | 0 | 0 | 0 | 0 | 0 | 0 |
What this means. The September 2026 earnings per share figures conflict: the table uses 0.18, while the report's separate continuing-operations line says 0.67, so treat that period's per-share number cautiously.