Axon earnings date and guidance
MyStockButler's October 2026 analysis: Axon’s next results are expected on November 5, 2026. Watch whether year-end collections turn growth into cash.
What has Axon guided for 2026?
Management’s 2026 guidance calls for revenue growth of 32.0%–34.0%. It also sets adjusted EBITDA margin at 25.5% and normalized five-year bookings growth at 30.0%.
Cash conversion is the missing test. Axon paid for inventory and delivered products before collecting all customer payments, so operating cash flow fell from $408.3 million in 2024 to $211.3 million in 2025. Management still targets $600 million of operating cash flow and $450 million of free cash flow for 2026, with strong fourth-quarter collections expected. The growth promise therefore depends on cash arriving at year-end, not merely on accounting earnings.
| Period guided | Low | High | Date given | |
|---|---|---|---|---|
| Revenue growth | Year to Dec 2026 | 32.0% | 34.0% | Aug 5, 2026 |
| Five-year normalized bookings growth | Year to Dec 2026 | 30.0% | Aug 5, 2026 | |
| Adjusted EBITDA margin | Year to Dec 2026 | 25.5% | 25.5% | Aug 5, 2026 |
| Operating cash flow ($ millions) | Year to Dec 2026 | 600 | May 6, 2026 | |
| Free cash flow ($ millions) | Year to Dec 2026 | 450 | 450 | May 6, 2026 |
Has Axon kept its past promises?
Management has a credible execution record, but shareholders must ask whether value per share keeps pace with the ownership transferred to employees.
How have Axon’s revenue and profit changed recently?
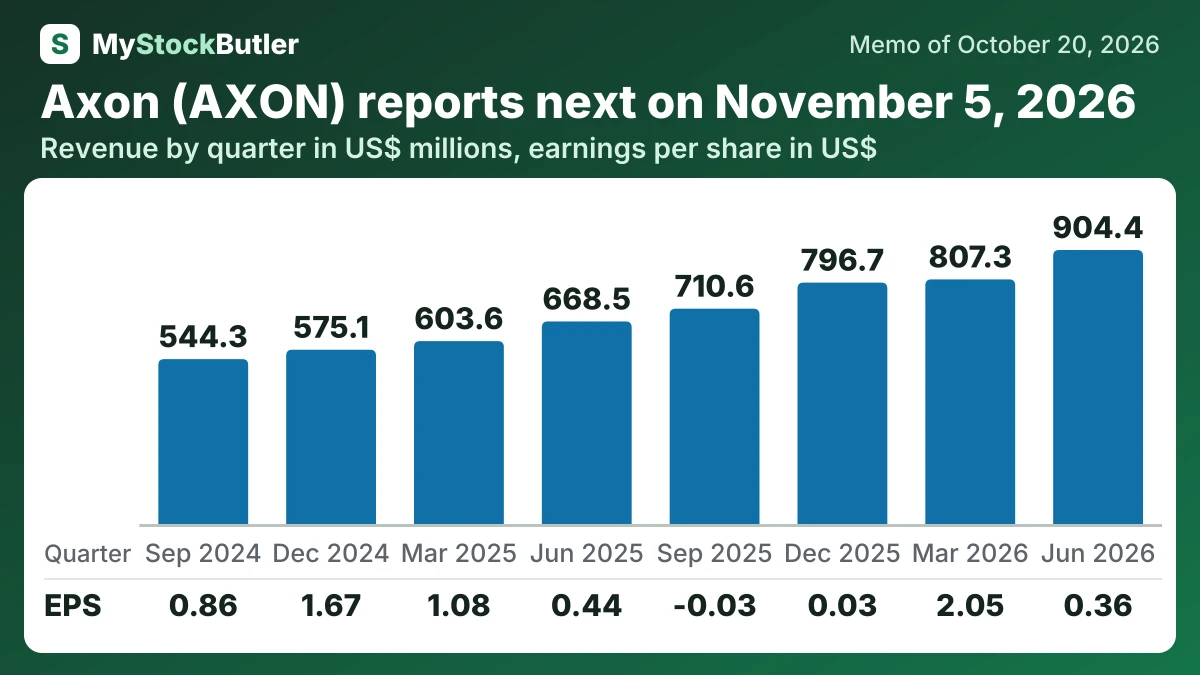
Sales momentum continued across the last eight quarters, but per-share earnings moved differently. That gap points toward stock compensation, convertible securities, investment gains and taxes. Revenue growth deserves attention, but the key question is whether it becomes operating profit and value for each share.
| Jun 2026 | Mar 2026 | Dec 2025 | Sep 2025 | Jun 2025 | Mar 2025 | Dec 2024 | Sep 2024 | |
|---|---|---|---|---|---|---|---|---|
| Revenue | 904,389 | 807,345 | 796,724 | 710,641 | 668,538 | 603,633 | 575,145 | 544,274 |
| Gross margin | 60.4% | 59.1% | 57.9% | 60.1% | 60.4% | 60.6% | 60.1% | 60.8% |
| Operating income | 46,778 | 29,243 | -50,118 | -2,129 | -1,036 | -8,793 | -15,755 | 24,081 |
| Net income | 29,427 | 169,312 | 2,745 | -2,186 | 36,117 | 87,980 | 135,184 | 67,025 |
| EPS, diluted | 0.36 | 2.05 | 0.03 | -0.03 | 0.44 | 1.08 | 1.67 | 0.86 |
| = Free cash flow | -972 | -54,642 | 155,427 | 33,379 | -114,657 | 932 | 225,365 | 64,849 |
What this means. The revenue growth can look stronger because it includes sales from companies the business bought, so it does not show how much the existing business grew on its own.
What should I watch in Axon’s next results?
The next decisive evidence will be whether year-end collections turn growth into cash. Axon expects especially strong fourth-quarter cash generation, so the Q3 report and December 2026 year-end should show whether inventory growth moderates and customer payments arrive. A higher revenue forecast alone would not prove that cash conversion improved.