Amcor stock forecast 2027–2029
MyStockButler's October 2026 analysis: Amcor's weighted price is US$59.60 in October 2027 and US$62.62 by October 2029. Amcor's forecast hinges on Berry synergies and working-capital recovery becoming cash and reducing debt.
Where could Amcor's shares be by October 2029?
The weighted price is US$59.60 in October 2027, a 34% total return including dividends. By October 2029, it is US$62.62, a 52% total return. The forecast assigns 28% to the bear case and 54% to the base case. The bull case carries 18%.
The last-date range is wide: $33.56 in the bear case to $97.66 in the bull case. The final probabilities are 28% bear, 54% base and 18% bull.
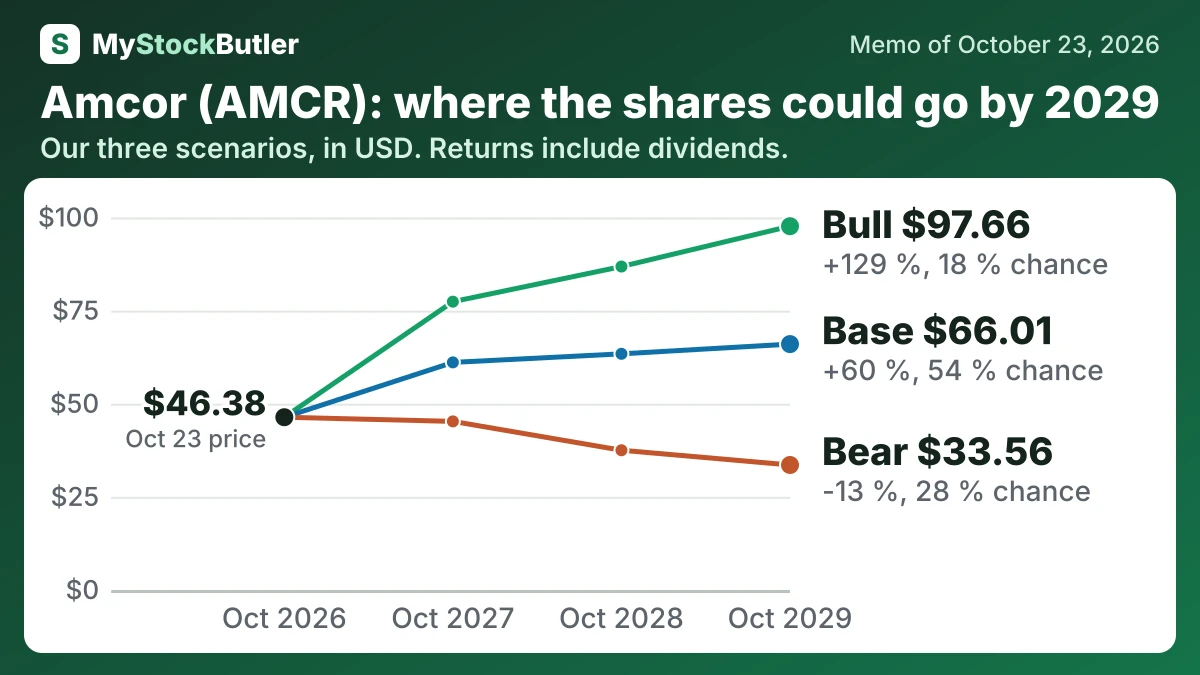
| Case | Probability | October 2027 | October 2028 | October 2029 |
|---|---|---|---|---|
| Bear | 28 % | 45.26 (+3 %) | 37.51 (-9 %) | 33.56 (-13 %) |
| Base | 54 % | 61.10 (+37 %) | 63.40 (+48 %) | 66.01 (+60 %) |
| Bull | 18 % | 77.40 (+73 %) | 86.83 (+99 %) | 97.66 (+129 %) |
| Weighted | 100 % | 59.60 (+34 %) | 60.37 (+41 %) | 62.62 (+52 %) |
What this means. The weighted row is the probability-based average of the bear, base, and bull cases, not a separate forecast.
What has to go right or wrong for Amcor?
The bear case assumes volume recovery stalls, mix stays weak and synergies arrive slowly. Working capital and integration costs absorb cash, debt falls little and investors apply a lower multiple to uncertain earnings. The price is $45.26 in October 2027 and falls to $33.56 by October 2029. Its 28% probability reflects 2% volume decline, $12.9B of net debt and real free cash flow below dividends, although recurring packaging demand and realized synergies limit the downside probability.
The bull case requires volume recovery across major end markets, better mix, faster synergy delivery and repeat revenue from customer awards. Working-capital release then accelerates debt reduction and supports a rerating. The price is $77.40 in October 2027 and reaches $97.66 by October 2029. Its 18% probability reflects the need for several uncertain execution steps to succeed together.
How much cash does Amcor really make?
After allowing for $83 million of stock pay, “real free cash flow” was $1.1 billion, less than the $1.2 billion paid in dividends. Stock pay is not a current cash payment, but it represents dilution. The cash question therefore leads directly to debt capacity.
| Jun 2026 | Jun 2025 | Jun 2024 | Jun 2023 | Jun 2022 | |
|---|---|---|---|---|---|
| Cash from operations | 2,151 | 1,390 | 1,321 | 1,261 | 1,526 |
| − Capital spending | 922 | 580 | 492 | 526 | 527 |
| = Free cash flow | 1,229 | 810 | 829 | 735 | 999 |
| − Stock pay | 83 | 74 | 32 | 54 | 63 |
| = Real free cash flow | 1,146 | 736 | 797 | 681 | 936 |
What this means. The company's own free cash flow is higher because it leaves out some cash costs and other adjustments that we include, so its number is bigger than ours.
What does Amcor's stock price pay for in earnings and cash?
| Today (Oct 23, 2026) | |
|---|---|
| Share price | 46.375 |
| Market value (calculated) | 21,441.28 |
| Enterprise value (calculated) | 34,338.28 |
| P/E, next 12 months (calculated) | 10.6x |
| Free cash flow yield (calculated) | 5.7% |
| Real free cash flow yield (calculated) | 5.3% |
What this means. The next-12-month price-to-earnings ratio uses analysts’ estimates of future profit, so it is not based on money the company has already earned.