Allegion dividend: payout, cash coverage and yield
MyStockButler's October 2026 analysis: Allegion’s forecast base dividend path rises to $2.32, $2.56 and $2.80 per share, while 2025 free cash flow was $685.7 million. Dividends were the steady commitment, buybacks were adjustable, and shareholder payments consumed a substantially lower share of free cash flow by 2025.
How much does Allegion pay per share?
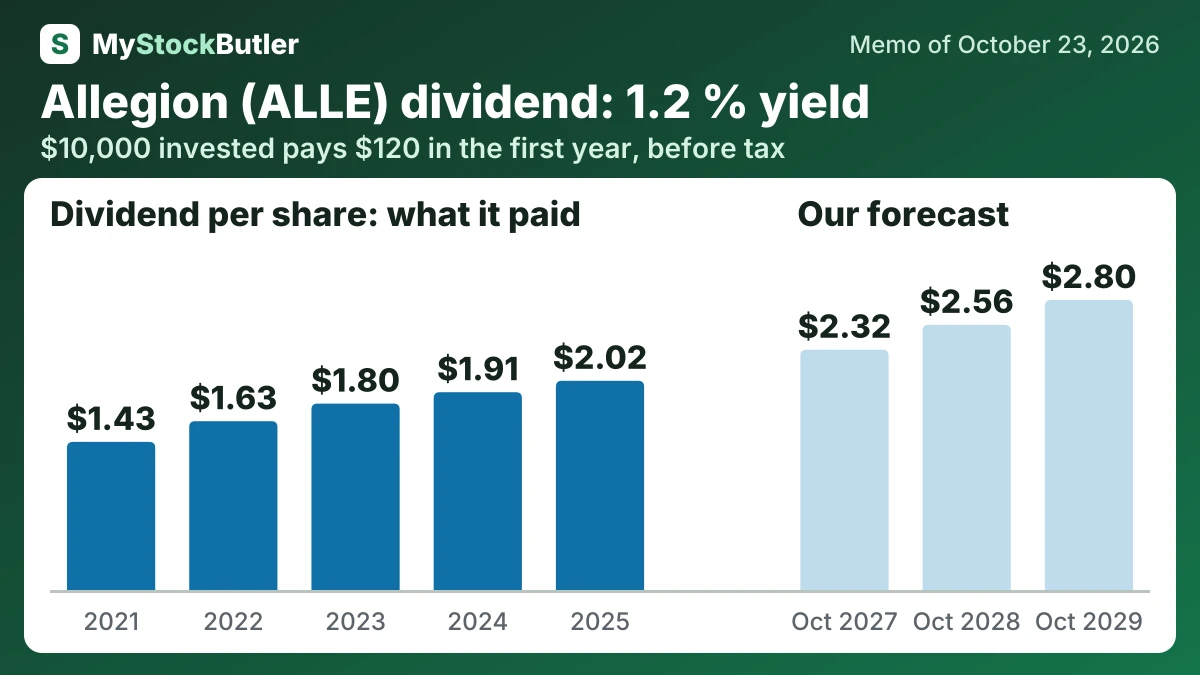
The base dividend path rises to $2.32, $2.56 and $2.80 per share. It follows the latest 8% increase and the record of annual increases. The bear case holds the quarterly dividend at $0.55, producing $2.20 each year. The bull case assumes 10% annual increases, reaching $2.92 by 2029. The low payout burden supports continuation, but debt and acquisitions could force a pause.
| October 2027 | October 2028 | October 2029 | |
|---|---|---|---|
| Earnings | 765 (702 / 786) | 810 (728 / 866) | 857 (758 / 953) |
| Shares (millions) | 83.24 (83.96 / 82.65) | 82.27 (83.63 / 81.15) | 81.40 (83.32 / 79.80) |
| Dividends per share | 2.32 (2.20 / 2.42) | 2.56 (2.20 / 2.66) | 2.80 (2.20 / 2.92) |
| Price to earnings | 21.00 (18.00 / 24.00) | 20.00 (17.00 / 24.00) | 19.00 (16.00 / 23.00) |
How much would Allegion's dividend pay you?
$10,000 invested in Allegion at its 1.2% dividend yield (our report of October 23, 2026) pays $120.00 in the first year, before tax. If its dividend per share keeps changing 9.0% a year, as it did from 2021 to 2025, and the dividends are reinvested, year 10 pays $304.80, with $1,981.06 received in all.
Before tax. Past dividend growth is not a promise. Information only, not investment advice.
Does Allegion's dividend come from its cash?
Dividends were the steady commitment, while buybacks were adjustable. Allegion repurchased heavily in 2021, when total shareholder payments exceeded free cash flow. By 2025, buybacks were much smaller and shareholder payments consumed a substantially lower share of free cash flow. That left more money inside the company for acquisitions and debt management.
Allegion’s earnings increasingly turn into cash after capital spending. Operating cash flow was $783.8 million in 2025. Capital investment consumed $98.1 million, leaving $685.7 million of available cash flow.
| 2025 | 2024 | 2023 | 2022 | 2021 | |
|---|---|---|---|---|---|
| Free cash flow | 685.7 | 582.9 | 516.4 | 395.5 | 443.2 |
| − Dividends paid | 175.3 | 167.0 | 158.7 | 143.9 | 129.0 |
| − Share buybacks | 80.0 | 220.0 | 59.9 | 61.0 | 412.8 |
| = Free cash flow not paid out | 430.4 | 195.9 | 297.7 | 190.4 |
What could change Allegion's dividend?
The forecast would move toward bear if project conversion weakens during 2027–2029, price no longer offsets lower volume, or International organic growth remains flat or negative. A higher-cost refinancing of the 2027 maturity, combined with slower cash conversion, would reduce debt paydown and buybacks.
What is Allegion's dividend yield against its share price?
Available cash flow is closer to spendable cash. It starts with cash collected from operations and subtracts capital spending, such as factory equipment, but management can still use it for debt repayment, acquisitions, dividends or buybacks. Allegion generated $539.4 million of available cash flow in the first nine months of 2026. The 4.6% cash-flow yield and 1.2% dividend yield are useful only if that cash is repeatable; the separate 4.4% “real” cash-flow yield needs reconciliation before it can support a conclusion.
| Today (Oct 23, 2026) | |
|---|---|
| Share price | 176.52 |
| Free cash flow yield (calculated) | 4.6% |
| Real free cash flow yield (calculated) | 4.4% |
| Dividend yield (calculated) | 1.2% |
What this means. The next-year price-to-earnings ratio uses analysts’ estimated profit, so it may be wrong if the company earns more or less than expected.