Allegion stock forecast 2027–2029
MyStockButler's October 2026 analysis: The Allegion weighted scenario reaches $189.42 in October 2027, equivalent to a return including dividends of 9%. It hinges on Americas demand becoming durable cash before the 2027 maturity competes with investment and buybacks.
Where could Allegion’s shares be by October 2029?
The forecast points to modest probability-weighted gains, but a wide range of possible outcomes. At $176.52 today, the weighted price reaches $189.42 in October 2027, $196.52 in October 2028 and $201.34 in October 2029, equivalent to returns including dividends of 9%, 14% and 18%.
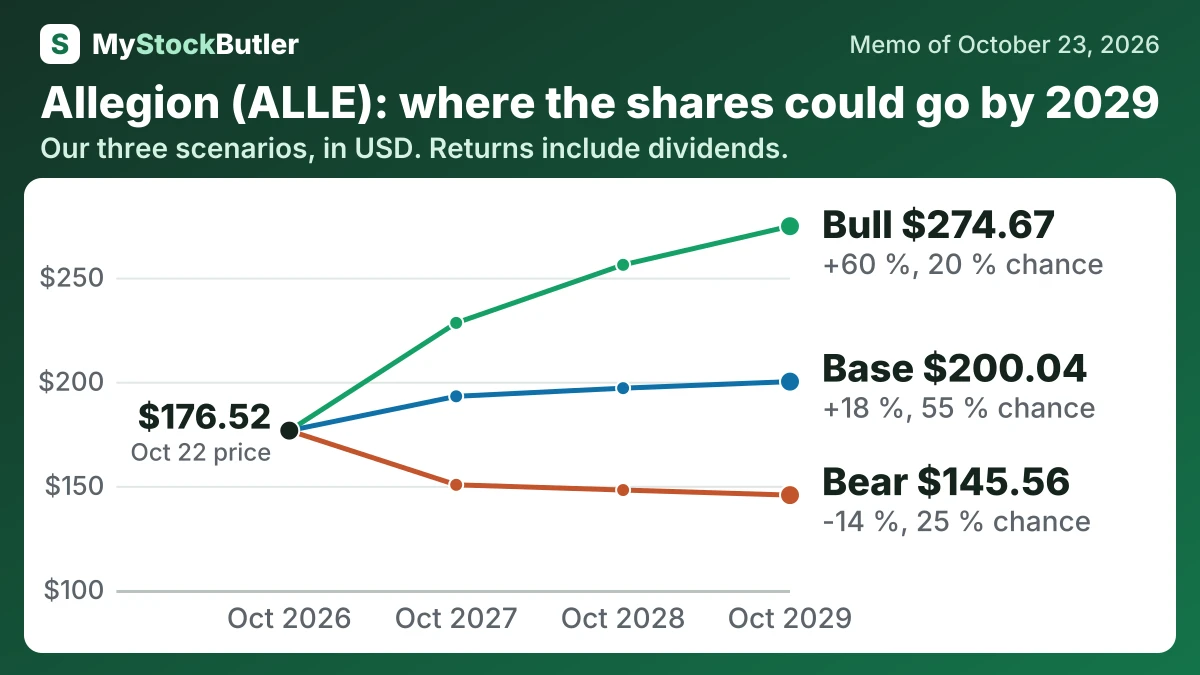
| Case | Probability | October 2027 | October 2028 | October 2029 |
|---|---|---|---|---|
| Bear | 25 % | 150.50 (-13 %) | 147.99 (-14 %) | 145.56 (-14 %) |
| Base | 55 % | 193.00 (+11 %) | 196.91 (+14 %) | 200.04 (+18 %) |
| Bull | 20 % | 228.24 (+31 %) | 256.12 (+48 %) | 274.67 (+60 %) |
| Weighted | 100 % | 189.42 (+9 %) | 196.52 (+14 %) | 201.34 (+18 %) |
What this means. The weighted row is the probability-based average of the bear, base, and bull cases, not a separate prediction.
What has to go right or wrong for Allegion?
The bear path reaches $702 million, $728 million and $758 million as construction delays, weaker Americas volume, International weakness and financing costs hold margins near 15%. The bull path reaches $786 million, $866 million and $953 million as electronic conversion, project demand, International recovery and acquisition traction lift both revenue and margins. Q3 Americas organic growth was 9.1%, split between 4.6% volume and 4.5% price, while International organic revenue fell 0.2%.
How much cash does Allegion really make?
Stock compensation is another ownership cost. Allegion paid $29.8 million in stock compensation in 2025; deducting it leaves an analytical “real free cash flow” figure of $655.9 million. The measure is useful, but it is not the company’s definition.
| 2025 | 2024 | 2023 | 2022 | 2021 | |
|---|---|---|---|---|---|
| Cash from operations | 783.8 | 675.0 | 600.6 | 459.5 | 488.6 |
| − Capital spending | 98.1 | 92.1 | 84.2 | 64.0 | 45.4 |
| = Free cash flow | 685.7 | 582.9 | 516.4 | 395.5 | 443.2 |
| − Stock pay | 29.8 | 28.2 | 26.4 | 24.5 | 23.4 |
| = Real free cash flow | 655.9 | 554.7 | 490.0 | 371.0 | 419.8 |
What this means. The company's own free cash flow is the same as ours, but our real free cash flow is lower because shares given to employees reduce shareholders' ownership even though no cash leaves today.
What does an investor pay for Allegion today?
The trailing P/E of 22.0x values each dollar of recent earnings at about $22. The forward P/E of 19.6x uses expected earnings instead, so it looks cheaper only if the forecast arrives. Reported earnings benefited from tariff refunds, while adjusted earnings excluded those refunds and added back acquisition amortization and other costs. The multiple therefore says less than it appears to say until the repeatable earnings base is clear.
| Today (Oct 23, 2026) | |
|---|---|
| Share price | 176.52 |
| P/E, last 12 months (calculated) | 22.0x |
| P/E, next 12 months (calculated) | 19.6x |
| Free cash flow yield (calculated) | 4.6% |
| Real free cash flow yield (calculated) | 4.4% |
What this means. The next-year price-to-earnings ratio uses analysts’ estimated profit, so it may be wrong if the company earns more or less than expected.