Albemarle stock forecast 2027–2029
MyStockButler's October 2026 analysis: Albemarle's weighted forecast is 186.61 in October 2029. It hinges on lithium recovery and reliable project execution.
Where could Albemarle's shares be by 2029?
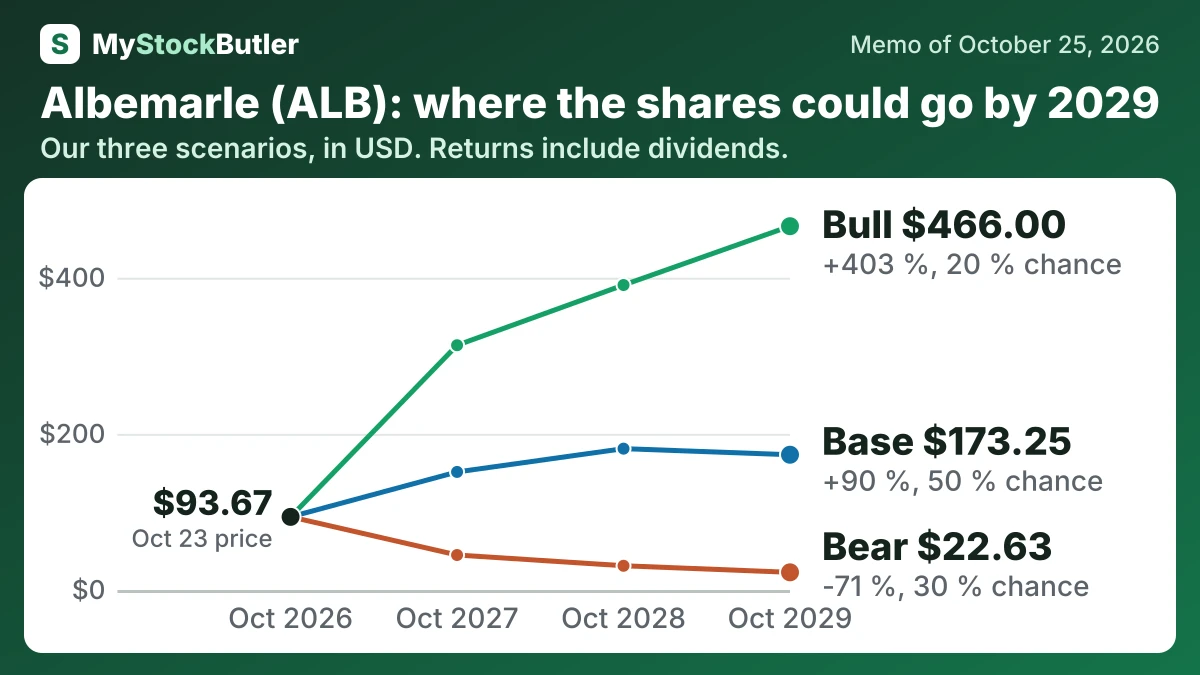
The probability-weighted price is 151.76 in October 2027, a 64% return including dividends. It reaches 177.98 in October 2028, a 94% return. By October 2029, it reaches 186.61, a 104% return.
The October 2029 range runs from 22.63 in the bear case to 466.00 in the bull case. Today's price is 93.67. The bear probability is 30% and the base probability is 50%. The bull probability is 20%.
| Case | Probability | October 2027 | October 2028 | October 2029 |
|---|---|---|---|---|
| Bear | 30 % | 44.81 (-50 %) | 31.05 (-63 %) | 22.63 (-71 %) |
| Base | 50 % | 151.23 (+63 %) | 181.06 (+97 %) | 173.25 (+90 %) |
| Bull | 20 % | 313.51 (+236 %) | 390.64 (+321 %) | 466.00 (+403 %) |
| Weighted | 100 % | 151.76 (+64 %) | 177.98 (+94 %) | 186.61 (+104 %) |
What this means. The weighted value is the probability-based average of the bear, base, and bull cases, not a promise that the shares will be worth that amount.
What has to go right or wrong for Albemarle?
EBITDA carries the largest risk and explains most of the price range. The base case starts at 2,500 million in October 2027 and rises to 2,700 million in 2028. It eases to 2,600 million in 2029 as lithium margins moderate. The bear path starts at 1,000 million and ends at 700 million as prices, volumes and older feedstock pressure earnings. The bull path starts at 4,100 million and ends at 4,800 million as demand absorbs supply and CGP3 ramps successfully. Management's $20/kg case supports 2.4–2.6 billion of 2026 EBITDA, while its $30/kg case supports 4.2–4.4 billion.
The base case is supported if the $500 million capital plan and cost improvements hold through 2026–2028, while Q2's operating recovery persists. The March 2027 preferred conversion remains a fixed dilution event that can reduce per-share gains even if earnings improve.
| October 2027 | October 2028 | October 2029 | |
|---|---|---|---|
| EBITDA | 2,500 (1,000 / 4,100) | 2,700 (800 / 4,500) | 2,600 (700 / 4,800) |
| Shares (millions) | 138 (139 / 136) | 138 (140 / 136) | 138 (140 / 136) |
| Dividends per share | 1.64 (1.64 / 1.68) | 1.68 (1.64 / 1.80) | 1.72 (1.00 / 1.92) |
| Enterprise value to ebitda | 8.00 (6.50 / 10.00) | 8.50 (6.00 / 11.00) | 8.00 (5.50 / 12.00) |
| Net debt | -799 (253 / -1,547) | -1,988 (462 / -3,572) | -3,096 (682 / -5,781) |
What this means. Negative net debt means the company has more cash than borrowed money.
How much cash does Albemarle really make?
Free cash flow was $692.5 million in 2025, compared with negative $992.7 million in 2024. The improvement mostly reflects the fall in construction spending, not an equivalent rise in durable profit. Slowing or completing expansion releases cash immediately, but does not prove that the same cash can be distributed every year.
| 2025 | 2024 | 2023 | 2022 | 2021 | |
|---|---|---|---|---|---|
| Cash from operations | 1,282,267 | 687,876 | 1,326,583 | 1,912,416 | 344,257 |
| − Capital spending | 589,801 | 1,680,529 | 2,154,542 | 1,261,646 | 953,667 |
| = Free cash flow | 692,466 | -992,653 | -827,959 | 650,770 | -609,410 |
| − Stock pay | 40,271 | 32,141 | 36,545 | 30,474 | 20,120 |
| = Real free cash flow | 652,195 | -1,024,794 | -864,504 | 620,296 | -629,530 |
| Real free cash flow, % of revenue | 12.7% | -19.1% | -9.0% | 8.5% | -18.9% |
What this means. Real free cash flow is lower because paying employees with shares uses no cash but gives away part of the company.