Chalco stock forecast 2027–2029
MyStockButler's October 2026 analysis: Chalco's weighted price is HKD5.25 in October 2027 and HKD5.76 by October 2029, with a 20% loss in 2027 and approximately a 0% return by 2029 including dividends. It hinges on weaker Chinese demand, extra alumina supply and successful Guinea execution.
Where could Chalco's shares be by 2029?
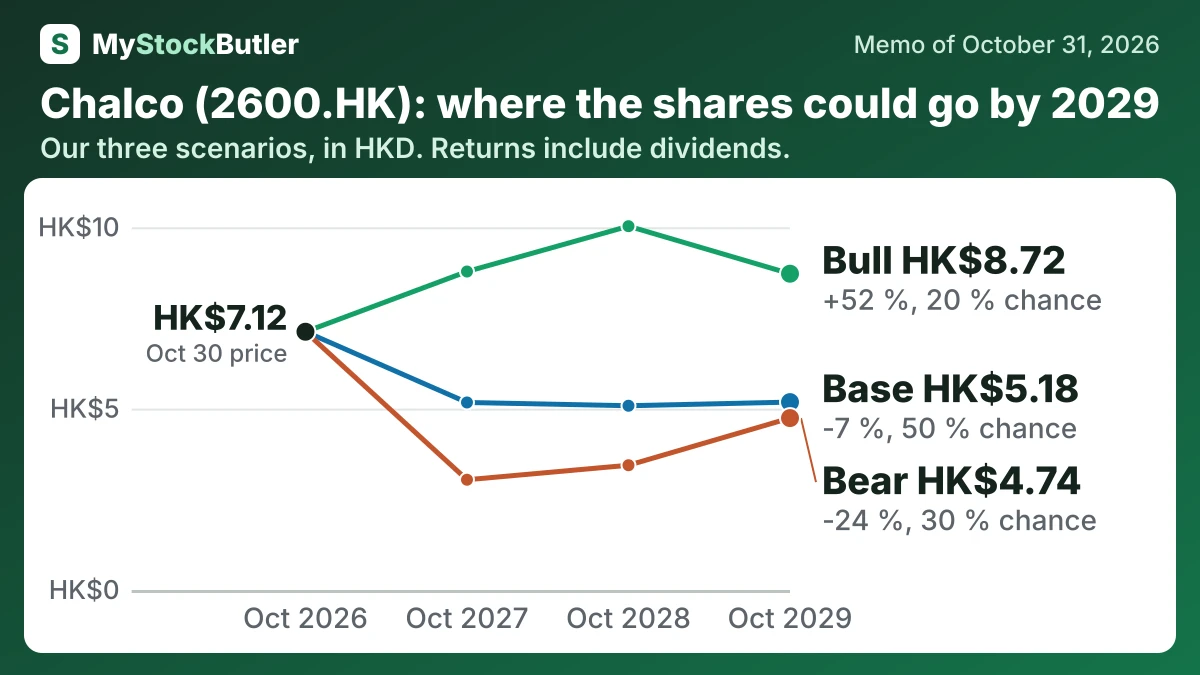
Against today’s HKD7.12, the weighted price is HKD5.25 in October 2027. That is a 20% loss including dividends. By October 2029, it is HKD5.76, implying approximately a 0% return including dividends. The bear case has a 30% probability; the base case has 50%. The bull case has 20%.
| Case | Probability | October 2027 | October 2028 | October 2029 |
|---|---|---|---|---|
| Bear | 30 % | 3.04 (-54 %) | 3.44 (-45 %) | 4.74 (-24 %) |
| Base | 50 % | 5.17 (-20 %) | 5.08 (-14 %) | 5.18 (-7 %) |
| Bull | 20 % | 8.78 (+32 %) | 10.03 (+60 %) | 8.72 (+52 %) |
| Weighted | 100 % | 5.25 (-20 %) | 5.58 (-9 %) | 5.76 (-0 %) |
What has to go right or wrong for Chalco?
The bear case requires weaker Chinese demand or extra alumina supply to reduce prices and utilization. Higher bauxite, power or transport costs would further compress margins, while Guinea delays would absorb cash. It gives HKD3.04 in October 2027 and HKD4.74 in October 2029. Its 30% probability reflects the wide earnings history and sharp alumina deterioration, but also the absence of a permanent balance-sheet collapse.
The bull case requires firm transport and power-network demand, disciplined smelter capacity, strong utilization and successful Guinea execution. Lower electricity use would protect margins and stronger cash conversion would support dividends and rerating. It gives HKD8.78 initially and HKD8.72 by October 2029. Its 20% probability reflects the upside from 2025 smelting economics, discounted for uncertain plant costs and project execution.
| October 2027 | October 2028 | October 2029 | |
|---|---|---|---|
| Normal operating profit | 20,845 (16,395 / 27,478) | 20,845 (17,608 / 27,478) | 20,845 (20,845 / 24,075) |
| Shares (millions) | 17,155 (17,154 / 17,155) | 17,154 (17,154 / 17,155) | 17,154 (17,153 / 17,155) |
| Dividends per share | 0.45 (0.20 / 0.55) | 0.42 (0.18 / 0.60) | 0.38 (0.18 / 0.62) |
| Enterprise value to normal operating profit | 3.80 (3.00 / 4.50) | 3.80 (3.20 / 5.00) | 3.80 (3.50 / 4.70) |
| Net debt | 4,075 (4,954 / -4,064) | 5,315 (6,358 / -8,555) | 3,869 (3,982 / -13,703) |
How much cash does Chalco really make?
Free cash flow depends on what the calculation deducts. The calculation here starts with operating cash and subtracts capital spending, lease payments and interest, producing RMB18,389.7 million in 2025. After stock pay, “real” free cash flow was RMB18,347.362 million. That is group cash, not automatically cash distributable to ordinary shareholders, because subsidiaries have other owners and the business has future obligations.
| 2025 | 2024 | 2023 | 2022 | 2021 | |
|---|---|---|---|---|---|
| = Free cash flow | 18,389.7 | 16,611.38 | 16,637.198 | 17,954.791 | 27,508.985 |
| − Stock pay | 42.338 | 66.822 | 91.111 | 48.258 | 0 |
| = Real free cash flow | 18,347.362 | 16,544.558 | 16,546.087 | 17,906.533 | 27,508.985 |
| Free cash flow, % of revenue | 7.6% | 7.0% | 7.4% | 6.2% | 9.2% |
| Real free cash flow, % of revenue | 7.6% | 7.0% | 7.3% | 6.2% | 9.2% |
What this means. This report’s free cash flow is a stricter measure because it also subtracts lease payments and interest paid.
What does an investor pay for Chalco today?
The forward P/E is low because it uses forecast earnings, not a normalised cycle. Chalco benefits when aluminium prices rise, while lower alumina prices can hurt its refining business even as they reduce an input cost for smelters. One unusually profitable year can therefore make the share price look cheaper than it would against average earnings.