ZTO dividend
MyStockButler's October 2026 analysis: ZTO pays shareholders through dividends and buybacks. ZTO’s dividend is supported by substantial free cash flow, but shareholder distributions can exceed free cash flow in some years.
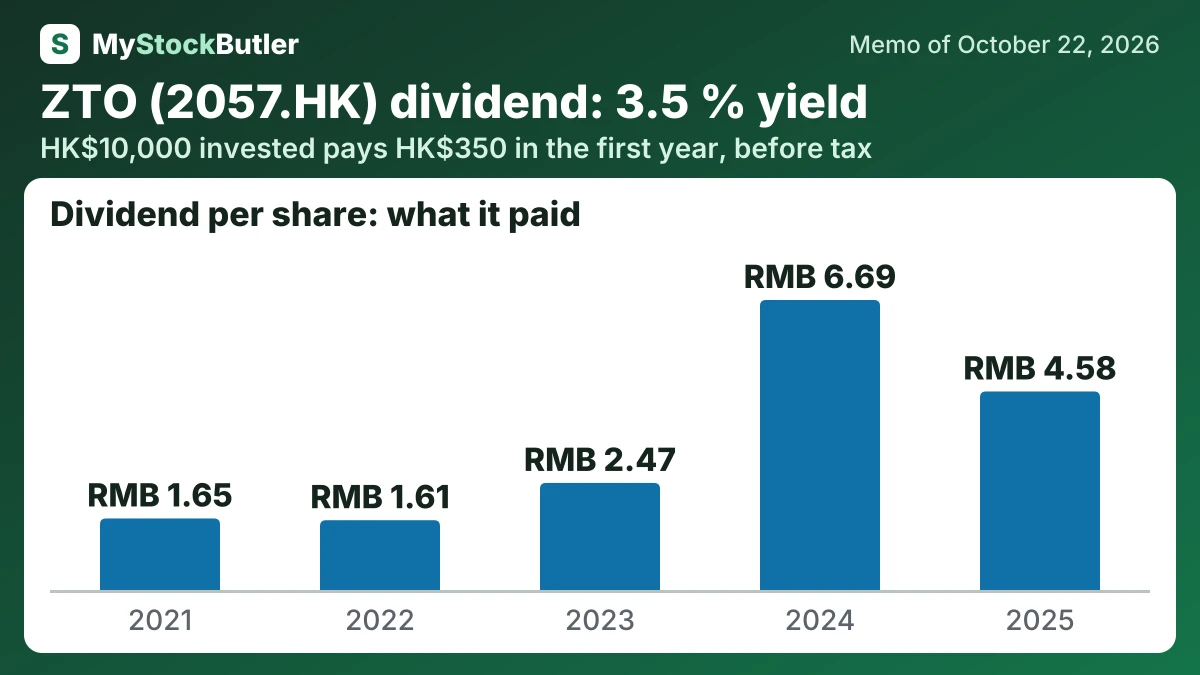
How much does ZTO pay per share?
Dividends are zero in the base case in 2027, then CNY2.8 per share and CNY2.9 per share. That reflects the skipped 2026 interim dividend and the return of payments near recent levels. The bear pays nothing because buybacks and operating pressure absorb cash; the bull pays CNY2.8 initially and CNY3.2 by 2029 because stronger earnings let the board allocate more of its return budget to dividends.
| 2025 | 2024 | 2023 | 2022 | 2021 | |
|---|---|---|---|---|---|
| − Paid to minority owners, per share | 0.03 | 0.00 | 0.00 | 0.00 | 0.00 |
| − Dividends paid, per share | 4.58 | 6.69 | 2.47 | 1.61 | 1.65 |
| − Share buybacks, per share | 1.53 | 1.38 | 1.20 | 0.10 | 4.65 |
| = FCF not paid out, per share | 2.10 | 4.47 | 3.66 |
What this means. Real free cash flow is lower because it subtracts the value of shares given to employees as pay, which can reduce each investor’s ownership.
How much would ZTO's dividend pay you?
HK$10,000 invested in ZTO at its 3.5% dividend yield (our report of October 22, 2026) pays HK$350.00 in the first year, before tax. If its dividend per share keeps changing 29.1% a year, as it did from 2021 to 2025, and the dividends are reinvested, year 10 pays HK$9,435.24, with HK$26,541.92 received in all.
Before tax. Past dividend growth is not a promise. Information only, not investment advice.
Is ZTO’s dividend covered by its cash?
ZTO generated RMB11,968.419 million from operations in 2025. Net income was RMB9,080.651 million. After equipment spending of RMB5,214.279 million, free cash flow was RMB6,754.140 million. After stock compensation of RMB229.250 million, the stock-pay-adjusted surplus was RMB6,524.890 million.
First-half repurchases totaled US$740 million. That equaled 52% of 2025 adjusted profit, so the board recommended no interim dividend. A buyback pays shareholders who sell and increases the proportional ownership of those who remain; it does not pay every holder. ZTO was therefore returning capital while making shareholder income less predictable. The next issue was whether the company’s cash generation could support that policy.
| 2025 | 2024 | 2023 | 2022 | 2021 | |
|---|---|---|---|---|---|
| Free cash flow | 6,754.14 | 6,221.28 | 6,832.134 | 4,411.564 | -1,140.28 |
| − Dividends paid | 3,755.452 | 5,605.451 | 2,072.509 | 1,323.205 | 1,353.969 |
| − Share buybacks | 1,252.741 | 1,157.472 | 1,006.451 | 84.547 | 3,810.586 |
| = Free cash flow not paid out | 1,720.987 | 3,753.174 | 3,003.812 | ||
| = Paid out more than the free cash flow | 541.643 | 6,304.835 |
What this means. The cash figures include money lent through its financial-services business, so they do not show only cash from its ordinary business.
What could change ZTO’s dividend?
Management guides to 40.8–42.4 billion parcels in 2026. The range implies 6%–10% growth and was revised on August 19, 2026. Management also targets annual dividends and buybacks of at least 50% of the previous year’s adjusted net income. That is a combined return target, not a dividend promise.
| Case | Probability | October 2027 | October 2028 | October 2029 |
|---|---|---|---|---|
| Bear | 28 % | 125.64 (-19 %) | 119.99 (-23 %) | 138.24 (-11 %) |
| Base | 52 % | 172.32 (+11 %) | 196.70 (+29 %) | 222.51 (+48 %) |
| Bull | 20 % | 209.63 (+37 %) | 270.24 (+79 %) | 345.10 (+129 %) |
| Weighted | 100 % | 166.71 (+8 %) | 189.93 (+25 %) | 223.43 (+48 %) |