AIA earnings: guidance, results and what to watch
MyStockButler's October 2026 analysis: AIA's latest results showed stronger core earnings and a sharper rise in net income. The next release should show whether visitor business remains profitable as product mix changes.
What has AIA guided for OPAT per share?
AIA measures recurring operating earnings with operating profit after tax, or OPAT. It targets compound annual growth of 9.0%–11.0% in OPAT per share over 2023–2026. On 20 August 2026, management said it expected to exceed that target after first-half OPAT per share grew 13%. Repurchases can help per-share growth because the same earnings are spread across fewer shares.
AIA also targets the return of 75.0% of annual net free surplus generation through dividends and repurchases. Its dividend policy is prudent, sustainable and progressive, while management wants the shareholder capital ratio comfortably above 200.0%. These promises work in sequence: capital must support the insurance business before it can support shareholders.
| The period it covers | Low | High | The date it was given | |
|---|---|---|---|---|
| OPAT per share CAGR target | 2023 to 2026 | 9.0% | 11.0% | 20 Aug 2026 |
| Shareholder payout ratio target | Annual; ongoing | 75.0% | 75.0% | 20 Aug 2026 |
| Shareholder capital ratio comfortably above 200% | Ongoing | 200.0% | 200.0% | 19 Mar 2026 |
| Prudent, sustainable and progressive dividend policy | Ongoing | 20 Aug 2026 |
Did AIA keep its first-half expectation?
AIA broadly met the clearest first-half expectation, although its markets and forecasts did not all point in the same direction.
What do AIA's last eight reported periods show?
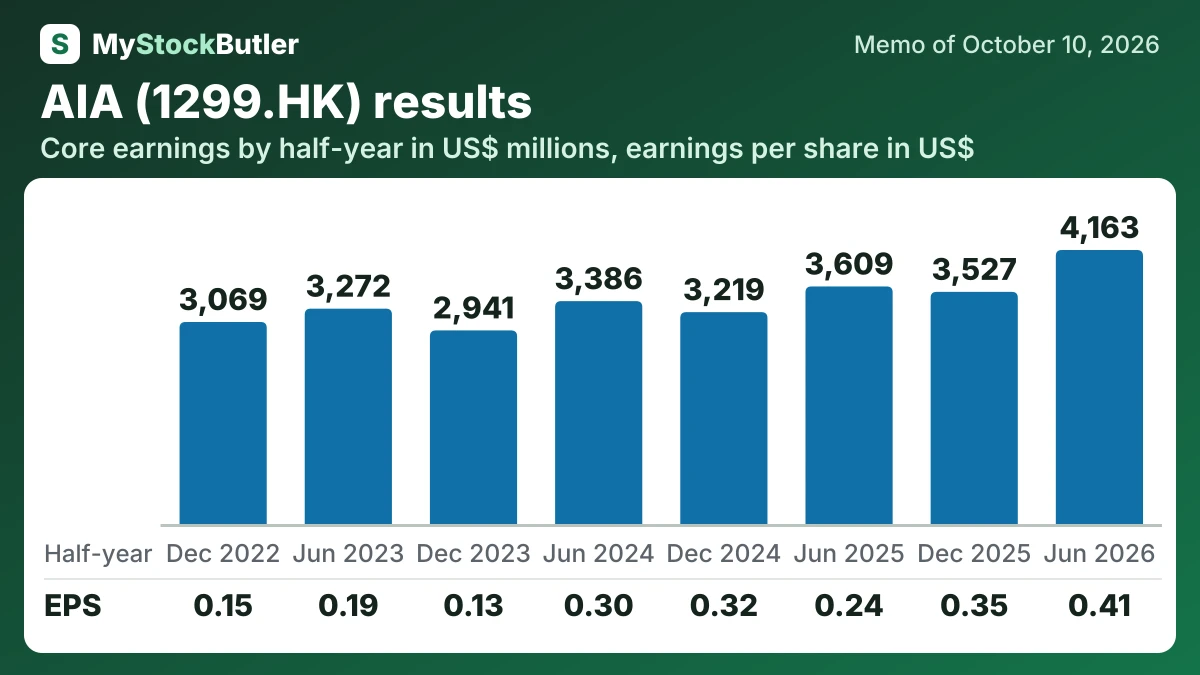
Core earnings improved, while net income rose more sharply because investment movements were more favourable. Short-term investment and discount-rate variances contributed US$511 million, compared with a US$754 million deduction a year earlier. Other comprehensive income, or OCI, moved in the opposite direction and recorded changes directly in equity outside net income.
| 6 months to Jun 2026 | 6 months to Dec 2025 | 6 months to Jun 2025 | 6 months to Dec 2024 | 6 months to Jun 2024 | 6 months to Dec 2023 | 6 months to Jun 2023 | 6 months to Dec 2022 | |
|---|---|---|---|---|---|---|---|---|
| Core earnings (company's measure) | 4,163 | 3,527 | 3,609 | 3,219 | 3,386 | 2,941 | 3,272 | 3,069 |
| Net income | 4,294 | 3,700 | 2,534 | 3,522 | 3,314 | 1,514 | 2,250 | 1,788 |
| EPS, diluted | 0.41 | 0.35 | 0.24 | 0.32 | 0.30 | 0.13 | 0.19 | 0.15 |
What should AIA watchers look for in the next release?
Timing is important. Strong first-half sales cannot prove resilience to tax and cross-border news that arrived afterward. The useful evidence will be third-quarter visitor business, product mix and profitability. Demand could remain strong while customers choose different policies, changing economics without causing a collapse in premiums.