COLI stock forecast 2027–2029
MyStockButler's October 2026 analysis: COLI's weighted forecast is HK$15.43 by October 2029; the bear, base and bull cases have probabilities of 32%, 53% and 15%. It hinges on earnings stabilizing, cash conversion improving and major-city projects selling profitably.
Where could COLI's shares be by October 2029?
Weighted price is HK$9.18 in October 2027, a 25% loss including dividends. By October 2029, it is HK$15.43, a 32% gain. The bear case has 32% probability; the base case has 53%. The bull case has 15%.
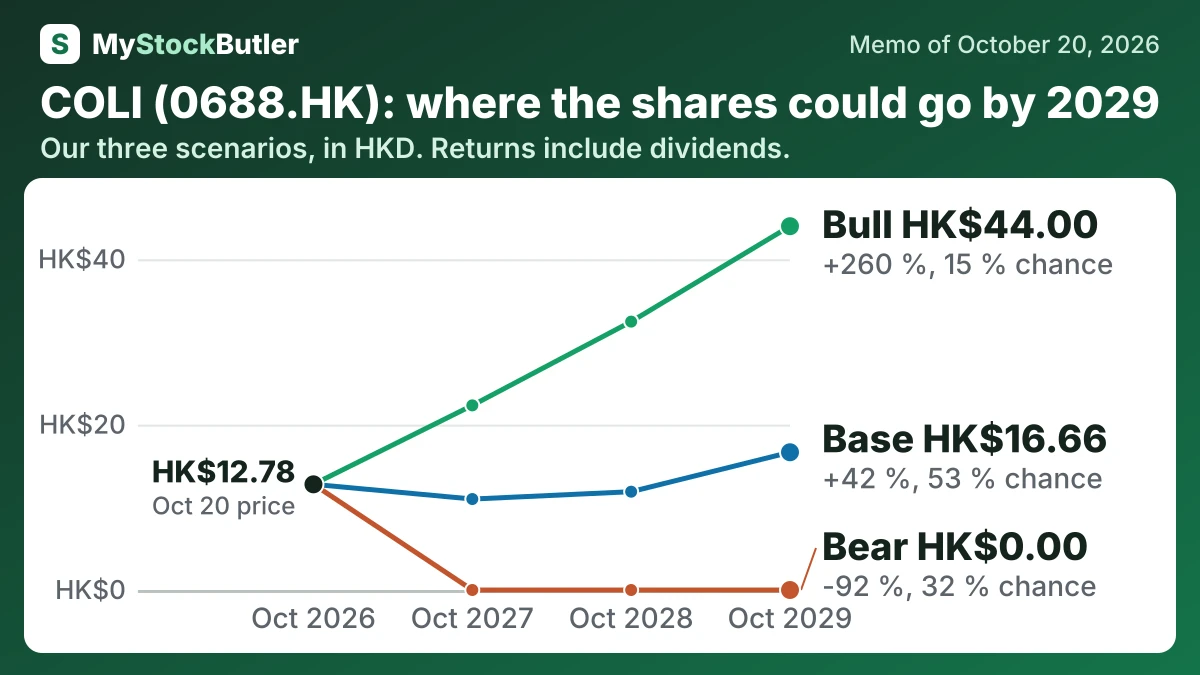
| Case | Probability | October 2027 | October 2028 | October 2029 |
|---|---|---|---|---|
| Bear | 32 % | 0.00 (-97 %) | 0.00 (-95 %) | 0.00 (-92 %) |
| Base | 53 % | 11.00 (-10 %) | 11.89 (+1 %) | 16.66 (+42 %) |
| Bull | 15 % | 22.33 (+79 %) | 32.46 (+164 %) | 44.00 (+260 %) |
| Weighted | 100 % | 9.18 (-25 %) | 11.17 (-5 %) | 15.43 (+32 %) |
What has to go right or wrong for COLI's forecast?
Operating profit is CNY23,625 million in October 2027. It rises to CNY24,300 million in October 2028 and CNY25,900 million in October 2029. This is above 2025’s CNY20,814.768 million, but below the stronger earlier years. First-half 2026 operating income increased to CNY12,547.178 million from CNY12,123.904 million, although gross margin fell from 17.4% to 16.1%. The bear row declines as national housing weakness, discounting and inventory charges spread; the bull row rises as major-city launches sell through at firm prices. National new-home sales area fell 9.2% in 2025, while first-tier cities and Hong Kong produced 68.6% of first-half contracted sales.
How much cash does COLI really make?
Free cash flow deducts capital spending, lease payments and interest paid. Interest matters because COLI classifies cash interest in financing activities. Across 2022-2024, real free cash flow ranged from negative RMB27,317.871 million to positive RMB33,088.165 million. One strong year therefore cannot establish normal cash-generating power.
| 2025 | 2024 | 2023 | 2022 | 2021 | |
|---|---|---|---|---|---|
| Cash from operations | 16,733.455 | 46,453.94 | 35,279.337 | -10,518.405 | 22,564.735 |
| − Capital spending | 5,625.254 | 4,263.459 | 7,280.951 | 7,400.929 | 9,919.61 |
| − Interest paid | 6,957.096 | 9,029.187 | 9,879.391 | 9,192.936 | 7,958.608 |
| = Free cash flow | 4,067.417 | 33,088.165 | 18,008.237 | -27,446.711 | 4,370.869 |
| − Stock pay | 0 | 0 | 0 | -128.84 | 116.009 |
| = Real free cash flow | 4,067.417 | 33,088.165 | 18,008.237 | -27,317.871 | 4,254.86 |
What this means. In 2022, stock pay is shown as a negative number, so subtracting it makes real free cash flow look higher even though no cash was paid.
What does an investor pay for COLI today?
At HK$12.78 on October 20, 2026, China Overseas Land & Investment Ltd. looks cheap against the assets recorded for its shareholders. The harder question is whether those assets can keep producing enough cash and profit to justify the price.
The valuation measures tell two different stories. P/E means the price paid for one year of profit per share: COLI’s trailing P/E is 10.8x, while its forward P/E is 9.7x. Price-to-book means the price paid for each unit of recorded shareholder equity, and COLI trades at 0.3x. Book equity is an accounting balance, not a promise that the assets could be sold for that amount.
| Today (Oct 20, 2026) | |
|---|---|
| Share price | 12.78 |
| P/E, last 12 months (calculated) | 10.8x |
| P/E, next 12 months (calculated) | 9.7x |
| Price to book (calculated) | 0.3x |
What this means. The enterprise value is much higher than the market value because it also includes the company's debt after subtracting its cash.