Johnson & Johnson vs Pfizer stock: the numbers side by side (October 2026)
How do Johnson & Johnson and Pfizer compare?
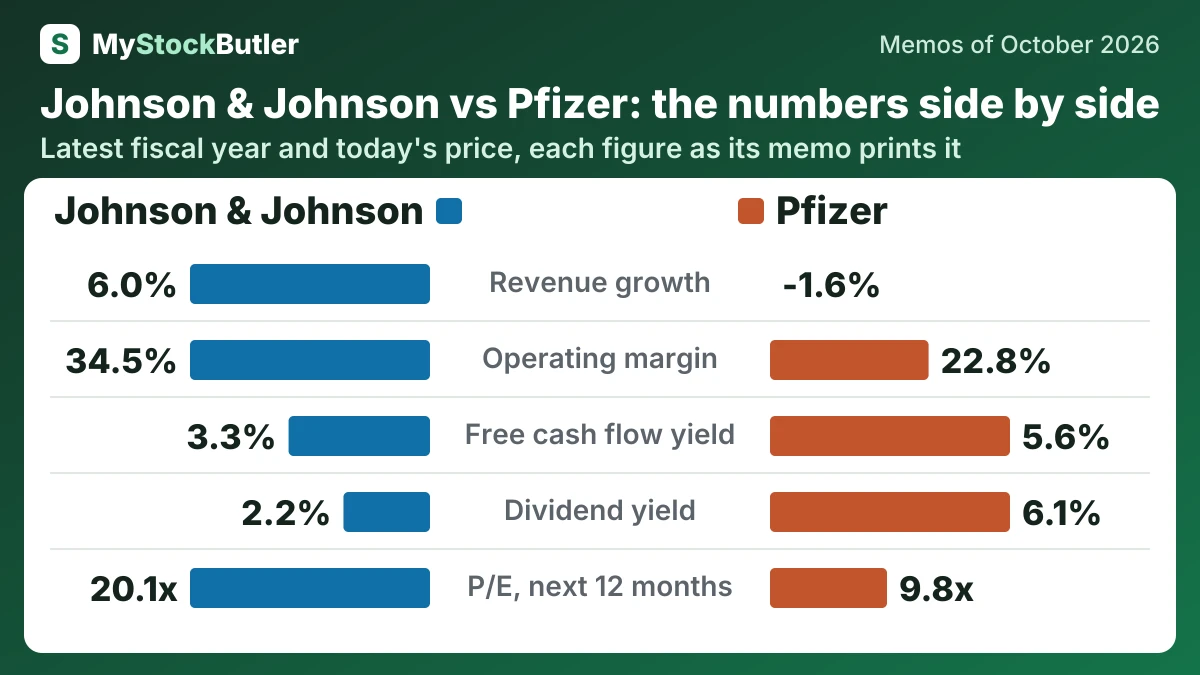
| Johnson & Johnson JNJ | Pfizer PFE | |
|---|---|---|
| Revenue growth | 6.0%2025 | -1.6%2025 |
| Operating margin | 34.5%2025 | 22.8%2025 |
| Free cash flow | 19,536US$ millions · 2025 | 9,075US$ millions · 2025 |
| Free cash flow yield | 3.3%Today (Oct 14, 2026) | 5.6%Today (Oct 13, 2026) |
| Dividend yield | 2.2%Today (Oct 14, 2026) | 6.1%Today (Oct 13, 2026) |
| P/E, last 12 months | 37.7xToday (Oct 14, 2026) | 37.2xToday (Oct 13, 2026) |
| P/E, next 12 months | 20.1xToday (Oct 14, 2026) | 9.8xToday (Oct 13, 2026) |
| Weighted price forecast, about 1 year | 229.07 (-6%)October 2027 | 26.44 (-0 %)October 2027 |
| Weighted price forecast, about 3 years | 251.90 (+8%)October 2029 | 29.42 (+23 %)October 2029 |
Who leads on what?
| Leads | The lead is | |
|---|---|---|
| Revenue growth | Johnson & Johnson | The higher figure |
| Operating margin | Johnson & Johnson | The higher figure |
| Free cash flow | Johnson & Johnson | The higher figure |
| Free cash flow yield | Pfizer | The higher figure |
| Dividend yield | Pfizer | The higher figure |
| P/E, last 12 months | Pfizer | The lower figure |
| P/E, next 12 months | Pfizer | The lower figure |
| Weighted price forecast, about 1 year | Pfizer | The higher weighted return |
| Weighted price forecast, about 3 years | Pfizer | The higher weighted return |
What does each company do?
Johnson & Johnson sells prescription medicines and medical devices through Innovative Medicine and MedTech.
Johnson & Johnson (JNJ), from our memo of October 14, 2026 · Johnson & Johnson stock forecast
Pfizer sells prescription medicines and vaccines in cancer, cardiovascular disease, vaccines, rare diseases and hospital care.
Pfizer (PFE), from our memo of October 13, 2026 · Pfizer stock forecast
How big are Johnson & Johnson and Pfizer?
Johnson & Johnson reported revenue of US$25,399 million in the quarter to September 2026, and Pfizer reported US$15,034 million in the quarter to June 2026.
How fast are Johnson & Johnson and Pfizer growing, and what did their latest results show?
Revenue at Johnson & Johnson grew 6.0% in 2025, and revenue at Pfizer fell 1.6% in 2025.
September 2026 revenue rose 5.9% year over year, while organic growth reached 6.1%. Gross margin fell from 69.6% to 68.1%, but that modest change cannot explain operating income collapsing from $7,511 million to $65 million.
Johnson & Johnson (JNJ), from our memo of October 14, 2026 · Johnson & Johnson earnings
Revenue reached 15,034 in June 2026, up from 14,653 a year earlier. Operational growth was only 1%, while sales excluding Comirnaty and Paxlovid grew faster. Gross margin fell from 74.2% to 72.8%, and operating income declined from 3,783 to 3,063.
Pfizer (PFE), from our memo of October 13, 2026 · Pfizer earnings
How much cash do Johnson & Johnson and Pfizer generate, and where does it go?
At Johnson & Johnson, free cash flow came to US$19,536 million in 2025; at Pfizer, it came to US$9,075 million in 2025. The dividend yield stood at 2.2% on October 14, 2026 for Johnson & Johnson and 6.1% on October 13, 2026 for Pfizer.
Profit records accounting income; cash flow records money collected and paid. J&J’s operating cash flow was $24,530 million in 2025, while free cash flow after capital spending was $19,536 million. A sale may be recorded before the customer pays, and inventory may consume cash before it is sold.
Johnson & Johnson (JNJ), from our memo of October 14, 2026 · Johnson & Johnson stock forecast
Cash from operations was 11,704 in 2025. After capital spending of 2,629, free cash flow was 9,075. The figure recovered from 2023, but it remained far below the pandemic-era cash rate.
Pfizer (PFE), from our memo of October 13, 2026 · Pfizer stock forecast
What does an investor pay for Johnson & Johnson and Pfizer today?
Johnson & Johnson traded at 37.7x the last 12 months’ earnings and 20.1x the next 12 months’ on October 14, 2026; Pfizer traded at 37.2x the last 12 months’ earnings and 9.8x the next 12 months’ on October 13, 2026. At Johnson & Johnson, the free cash flow yield was 3.3% on October 14, 2026; at Pfizer, it was 5.6% on October 13, 2026.
At $248.61, shareholders value J&J’s equity at $599,125 million. Enterprise value is $627,403 million because it adds net debt to the equity value. The difference is like buying a house while taking responsibility for its mortgage: the shares belong to investors, but the operating business must also support lenders. The EV-to-revenue multiple therefore values the whole business, not merely the stock.
Johnson & Johnson (JNJ), from our memo of October 14, 2026 · Johnson & Johnson dividend
Cash offers the harder test. In 2025, operating cash was $11.704 billion and equipment investment was $2.629 billion. That left $9.075 billion of free cash flow, below the $9.771 billion Pfizer paid in dividends. The 6.1% dividend yield therefore exceeds the 5.6% free-cash-flow yield. Pfizer can bridge that gap with cash reserves or borrowing for a time, but the historical record makes the next earnings cycle important.
Pfizer (PFE), from our memo of October 13, 2026 · Pfizer dividend