Fortis vs Emera stock: the numbers side by side (October 2026)
How do Fortis and Emera compare?
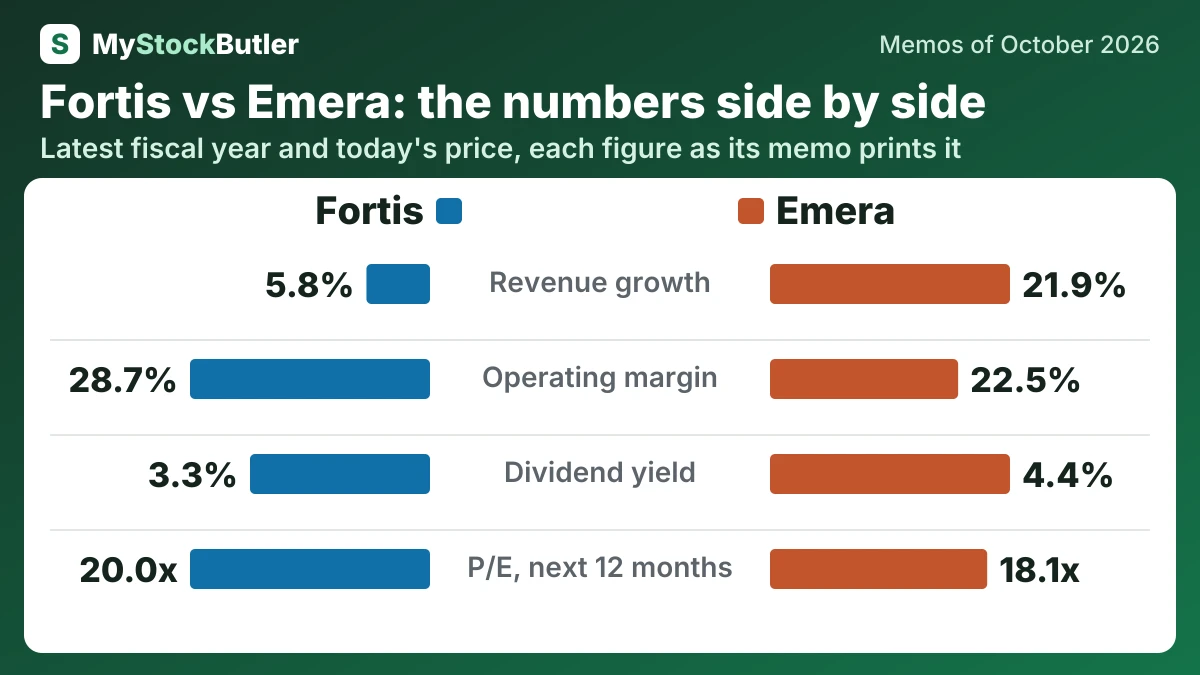
| Fortis FTS.TO | Emera EMA.TO | |
|---|---|---|
| Revenue growth | 5.8%2025 | 21.9%2025 |
| Operating margin | 28.7%2025 | 22.5%2025 |
| Dividend yield | 3.3%Today (Oct 16, 2026) | 4.4%Today (Oct 18, 2026) |
| P/E, last 12 months | 22.7xToday (Oct 16, 2026) | 21.1xToday (Oct 18, 2026) |
| P/E, next 12 months | 20.0xToday (Oct 16, 2026) | 18.1xToday (Oct 18, 2026) |
| Weighted price forecast, about 1 year | 76.97 (+3 %)October 2027 | 50.26 (-21 %)October 2027 |
| Weighted price forecast, about 3 years | 84.15 (+19 %)October 2029 | 64.12 (+8 %)October 2029 |
Who leads on what?
| Leads | The lead is | |
|---|---|---|
| Revenue growth | Emera | The higher figure |
| Operating margin | Fortis | The higher figure |
| Dividend yield | Emera | The higher figure |
| P/E, last 12 months | Emera | The lower figure |
| P/E, next 12 months | Emera | The lower figure |
| Weighted price forecast, about 1 year | Fortis | The higher weighted return |
| Weighted price forecast, about 3 years | Fortis | The higher weighted return |
What does each company do?
Fortis owns regulated electricity and gas networks—businesses whose prices and service a government regulator oversees—that connect generators and suppliers to homes and businesses.
Fortis (FTS.TO), from our memo of October 16, 2026 · Fortis stock forecast
Emera sells electricity and gas through local utilities, and sells pipeline capacity and energy services to businesses.
Emera (EMA.TO), from our memo of October 18, 2026 · Emera stock forecast
How big are Fortis and Emera?
Fortis reported revenue of C$2,931 million in the quarter to June 2026, and Emera reported C$2,011 million in the quarter to June 2026.
How fast are Fortis and Emera growing, and what did their latest results show?
Revenue at Fortis grew 5.8% in 2025, and revenue at Emera grew 21.9% in 2025.
Operating cash rose sharply, yet capital spending remained higher. Tax-credit sales and payment timing strengthened the quarter, so the cash increase should not be projected mechanically. Across eight quarters, Canadian heating and Arizona cooling create visible seasonality. The right test is year-on-year and year-to-date growth followed by a regulatory check.
Fortis (FTS.TO), from our memo of October 16, 2026 · Fortis earnings
Revenue was higher than in Q2 2025, and gross margin increased, while operating income improved. Net income nevertheless declined. The comparison included a C$19 million after-tax loss on the Grand Bahama Power sale and a C$59 million increase in after-tax mark-to-market losses. Q2 2025 also contained C$72 million of after-tax charges related to the pending NMGC sale.
Emera (EMA.TO), from our memo of October 18, 2026 · Emera earnings
How much cash do Fortis and Emera generate, and where does it go?
At Fortis, the dividend yield was 3.3% on October 16, 2026; at Emera, it was 4.4% on October 18, 2026.
Capital spending is different because Fortis must pay contractors to build or renew networks. The result is negative free cash flow before dividends. Fortis also shows a stricter “real” free-cash-flow view by treating stock compensation as an economic cost. Interest paid is already reflected in operating cash, so subtracting it again would count the same outflow twice.
Fortis (FTS.TO), from our memo of October 16, 2026 · Fortis stock forecast
Free cash flow is the cash left after capital spending. In 2025, Emera generated about C$1.8 billion from operations and spent about C$3.5 billion on investment, leaving real free cash flow negative by C$1,819 million. That can be rational for a utility building assets that may earn for decades, but the gap must be funded with borrowing, equity, asset sales or existing cash.
Emera (EMA.TO), from our memo of October 18, 2026 · Emera stock forecast
What does an investor pay for Fortis and Emera today?
The shares of Fortis were priced at 22.7x the last 12 months’ earnings and 20.0x the next 12 months’ on October 16, 2026; those of Emera at 21.1x the last 12 months’ earnings and 18.1x the next 12 months’ on October 18, 2026.
P/E divides the share price by earnings per share, showing what investors pay for one dollar of profit attributable to each share. Trailing earnings cover the previous twelve months, while forward earnings are estimates of the next twelve. Fortis’s 2025 reported earnings included C$63 million of disposal losses. Adjusted EPS was C$3.53 rather than reported EPS of C$3.40, and the DRIP means future profit may be divided among more shares.
Fortis (FTS.TO), from our memo of October 16, 2026 · Fortis stock forecast
The trailing P/E uses reported earnings; Emera’s last-twelve-month multiple is 21.1x. Its next-twelve-month multiple is 18.1x, based on expected earnings. Think of buying a bakery for $100: if it earned $5 last year, you paid 20 times its profit, but if you expect $6 next year, the forward multiple looks lower. The bakery has not become cheaper; the calculation assumes higher earnings. Emera’s apparent discount therefore disappears if growth does not arrive.
Emera (EMA.TO), from our memo of October 18, 2026 · Emera stock forecast