Couche-Tard vs Dollarama stock: the numbers side by side (October 2026)
How do Couche-Tard and Dollarama compare?
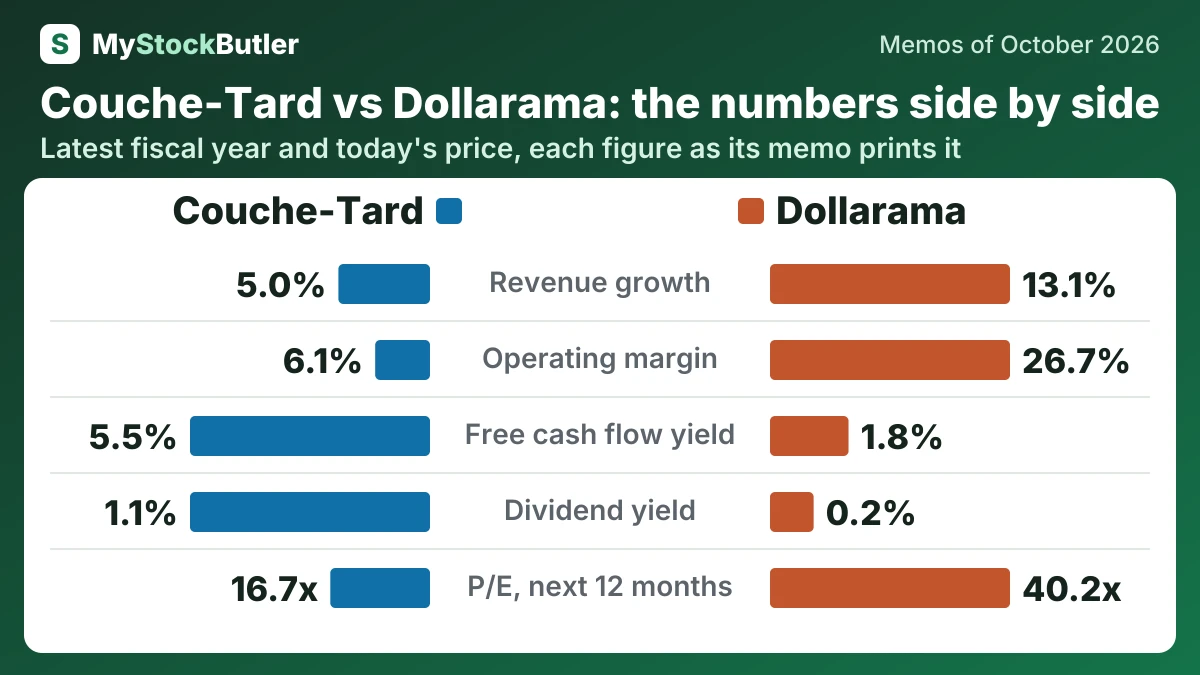
| Couche-Tard ATD.TO | Dollarama DOL.TO | |
|---|---|---|
| Revenue growth | 5.0%Apr 2026 | 13.1%Feb 2026 |
| Operating margin | 6.1%Apr 2026 | 26.7%Feb 2026 |
| Free cash flow | 2,791.0US$ millions · Apr 2026 | 1,007,560C$ thousands · Feb 2026 |
| Free cash flow yield | 5.5%Today (Oct 14, 2026) | 1.8%Today (Oct 26, 2026) |
| Dividend yield | 1.1%Today (Oct 14, 2026) | 0.2%Today (Oct 26, 2026) |
| P/E, last 12 months | 16.0xToday (Oct 14, 2026) | 41.5xToday (Oct 26, 2026) |
| P/E, next 12 months | 16.7xToday (Oct 14, 2026) | 40.2xToday (Oct 26, 2026) |
| Weighted price forecast, about 1 year | 75.96 (-2 %)October 2027 | 197.14 (-5 %)October 2027 |
| Weighted price forecast, about 3 years | 89.81 (+18 %)October 2029 | 217.08 (+6 %)October 2029 |
Who leads on what?
| Leads | The lead is | |
|---|---|---|
| Revenue growth | Dollarama | The higher figure |
| Operating margin | Dollarama | The higher figure |
| Free cash flow | — | The higher figure |
| Free cash flow yield | Couche-Tard | The higher figure |
| Dividend yield | Couche-Tard | The higher figure |
| P/E, last 12 months | Couche-Tard | The lower figure |
| P/E, next 12 months | Couche-Tard | The lower figure |
| Weighted price forecast, about 1 year | Couche-Tard | The higher weighted return |
| Weighted price forecast, about 3 years | Couche-Tard | The higher weighted return |
What does each company do?
Alimentation Couche-Tard runs a 17,267-site network selling fuel, convenience goods, prepared food and services to drivers, commuters, nearby shoppers and business fuel customers—companies buying fuel for vehicles or operations.
Couche-Tard (ATD.TO), from our memo of October 14, 2026 · Couche-Tard stock forecast
Dollarama sells everyday, household and seasonal goods to individual shoppers through stores and delivery platforms.
Dollarama (DOL.TO), from our memo of October 27, 2026 · Dollarama stock forecast
How big are Couche-Tard and Dollarama?
Couche-Tard’s revenue was US$21,704.8 million in the quarter to July 2026; Dollarama’s was C$2,026,645 thousand in the quarter to August 2026. The market valued Couche-Tard at C$72,188.6 million on October 14, 2026 and Dollarama at C$55,666,117 thousand on October 26, 2026.
How fast are Couche-Tard and Dollarama growing, and what did their latest results show?
Revenue at Couche-Tard grew 5.0% in the year to April 2026, and revenue at Dollarama grew 13.1% in the year to February 2026.
Revenue rose 25.1% to US$21,704.8 million for the 12 weeks ended July 19, 2026. About US$3.9 billion of the fuel-revenue increase came from higher selling prices, while U.S. same-store fuel volume fell 1.6%. More dollars therefore passed through the pumps without more comparable gallons.
Couche-Tard (ATD.TO), from our memo of October 14, 2026 · Couche-Tard earnings
Revenue grew 17.6% in Q2 FY2027, while operating income grew 7.0%. Net income reached C$349.3 million and diluted EPS reached C$1.29. EPS grew faster than net income because the diluted share count declined.
Dollarama (DOL.TO), from our memo of October 27, 2026 · Dollarama earnings
How much cash do Couche-Tard and Dollarama generate, and where does it go?
Couche-Tard’s free cash flow was US$2,791.0 million in the year to April 2026; Dollarama’s was C$1,007,560 thousand in the year to February 2026. At Couche-Tard, the dividend yield was 1.1% on October 14, 2026; at Dollarama, it was 0.2% on October 26, 2026.
Investment then claims cash. Capital spending was US$1,990.5 million, and lease payments were US$581.7 million. The resulting free cash flow was US$2,791.0 million. Deducting stock-based pay as an economic cost leaves real free cash flow of US$2,763.9 million, although that deduction is not an additional cash payment.
Couche-Tard (ATD.TO), from our memo of October 14, 2026 · Couche-Tard stock forecast
Operating cash was C$1.8 billion in FY2026 and became C$1.0 billion of free cash flow after capital spending, leases and interest. Deducting C$16.0 million of share-based compensation gives analytical “real” free cash flow of C$991.5 million. The deduction recognizes dilution: issuing shares costs existing owners part of the business.
Dollarama (DOL.TO), from our memo of October 27, 2026 · Dollarama stock forecast
What does an investor pay for Couche-Tard and Dollarama today?
Couche-Tard traded at 16.0x the last 12 months’ earnings and 16.7x the next 12 months’ on October 14, 2026; Dollarama traded at 41.5x the last 12 months’ earnings and 40.2x the next 12 months’ on October 26, 2026. Couche-Tard’s free cash flow yield was 5.5% on October 14, 2026; Dollarama’s was 1.8% on October 26, 2026.
The price-to-earnings ratio, or P/E, says how much investors pay for one dollar of annual earnings. Dollarama’s trailing P/E is 41.5x, which means a share priced at C$207.27 implies about C$4.99 of annual earnings per share. The reverse is an earnings yield of about 2.4%, not a promised return. The forward P/E is 40.2x, implying only about 3.2% growth between those two earnings measures.
Dollarama (DOL.TO), from our memo of October 27, 2026 · Dollarama stock forecast