TPL stock forecast 2027–2029
MyStockButler's October 2026 analysis: TPL's weighted outcome puts the price at $466.22 by October 2027. It hinges on operating growth supporting earnings while TPL retains a premium valuation.
Where could TPL's shares be by October 2029?
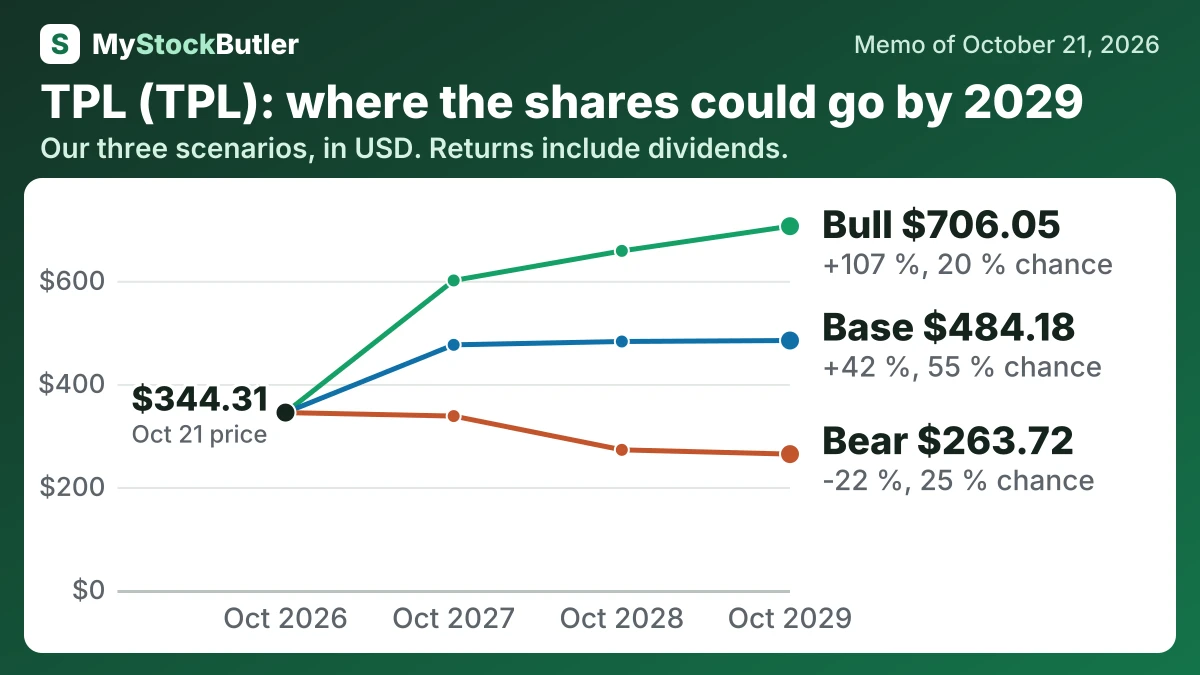
Weighted outcomes put the price at $466.22 by October 2027, a 36% return including dividends. They put it at $473.44 by October 2029, a 39% total return including dividends. The bear case has 25% probability. The base case has 55% probability. The bull case has 20% probability.
| Case | Probability | October 2027 | October 2028 | October 2029 |
|---|---|---|---|---|
| Bear | 25 % | 337.55 (-1 %) | 272.00 (-20 %) | 263.72 (-22 %) |
| Base | 55 % | 475.80 (+39 %) | 482.27 (+41 %) | 484.18 (+42 %) |
| Bull | 20 % | 600.72 (+75 %) | 658.14 (+92 %) | 706.05 (+107 %) |
| Weighted | 100 % | 466.22 (+36 %) | 464.87 (+36 %) | 473.44 (+39 %) |
What has to go right, and what could go wrong for TPL?
Normal operating profit rises from $894 million in the base case in October 2027 to $1,019 million in October 2029. The forecast applies the five-year average operating margin of 78.4% to revenue of $1,140 million, $1,220 million and $1,300 million. The latest quarter produced $191.817 million of operating income, while the first half produced $374.145 million, but the forecast does not extend that stronger run rate indefinitely. The bear case gives $760 million, $696 million and $760 million as weaker realizations, activity and water demand interrupt growth. The bull case gives $970 million, $1,113 million and $1,256 million if completions, realizations and new water revenue exceed expectations.
| October 2027 | October 2028 | October 2029 | |
|---|---|---|---|
| Normal operating profit | 894 (760 / 970) | 956 (696 / 1,113) | 1,019 (760 / 1,256) |
| Shares (millions) | 69.02 (69.04 / 68.93) | 69.06 (69.11 / 68.90) | 69.11 (69.18 / 68.88) |
| Dividends per share | 2.13 (2.13 / 2.13) | 2.13 (2.13 / 2.13) | 2.13 (2.13 / 2.13) |
| Enterprise value to normal operating profit | 36.00 (30.00 / 42.00) | 34.00 (26.00 / 40.00) | 32.00 (23.00 / 38.00) |
| Net debt | -656 (-506 / -668) | -803 (-703 / -826) | -853 (-765 / -905) |
How much cash does TPL really make?
A stricter analytical measure deducts stock pay. Neither measure deducts purchases of royalty interests, so TPL can generate abundant free cash flow while spending heavily on acquisitions. Capital spending also needs to be divided between maintaining existing water assets and expanding them.
| 2025 | 2024 | 2023 | 2022 | 2021 | |
|---|---|---|---|---|---|
| Cash from operations | 545,910 | 490,672 | 418,288 | 447,149 | 265,163 |
| − Capital spending | 59,531 | 29,696 | 15,028 | 19,212 | 15,548 |
| = Free cash flow | 486,379 | 460,976 | 403,260 | 427,937 | 249,615 |
| − Stock pay | 15,131 | 12,498 | 10,343 | 8,432 | 28 |
| = Real free cash flow | 471,248 | 448,478 | 392,917 | 419,505 | 249,587 |
| Real free cash flow, % of revenue | 59.0% | 63.5% | 62.2% | 62.9% | 55.3% |
What this means. The company's own free cash flow is higher because it leaves out employee stock pay and other costs, while our count treats them as real costs.
What does an investor pay for TPL today?
TPL’s market value and enterprise value are close, which means its cash cushion is small beside the price investors pay for the business. The stock’s trailing P/E is high, while its forward P/E is lower because the latter assumes earnings will grow. Free cash flow is different: it measures cash generated by the business, not cash automatically paid to shareholders. TPL can distribute, reinvest or use that cash for acquisitions.