Shell earnings date and guidance
MyStockButler's October 2026 analysis: Shell’s next results are expected on February 4, 2027. The key thing to watch is whether ARC’s added production becomes dependable cash.
What has Shell guided for the year?
Shell produces and sells energy, so its guidance covers both operations and money. For 2026, cash capital expenditure—the money spent buying and developing assets—is guided at $24–26 billion. The 2027 envelope is $20–22 billion, even as Shell integrates ARC Resources, a Canadian producer.
Shell has promised 4% annual dividend growth and a $3 billion buyback, while targeting shareholder distributions equal to 40–50% of operating cash flow through the commodity cycle. These are intentions, not guaranteed outcomes.
| The period guided | Low | High | The date it was given | |
|---|---|---|---|---|
| Cash capital expenditure (US$ billions) | Year to Dec 2026 | 24 | 26 | Jul 30, 2026 |
| Integrated Gas, Production (kboe/d) | Quarter to Sep 2026 | 740 | 780 | Oct 7, 2026 |
| Integrated Gas, Underlying opex (US$ billions) | Quarter to Sep 2026 | 1.3 | 1.5 | Oct 7, 2026 |
| Progressive Dividend, annual increase (%) | Years to Dec 2026 and Dec 2027 | 4.0% | 4.0% | Jul 30, 2026 |
| New Buyback (US$ billions) | Year to Dec 2026 | 3 | 3 | Jul 30, 2026 |
Has Shell kept its past promises?
Management also kept its promise to deliver $2–3 billion of structural savings by the end of 2025, saying it reached the target early. Buybacks outweighed share compensation and the diluted share count fell materially, but shareholders should still ask whether lower costs and fewer shares are supported by durable cash generation.
What has Shell’s revenue and profit trend been?
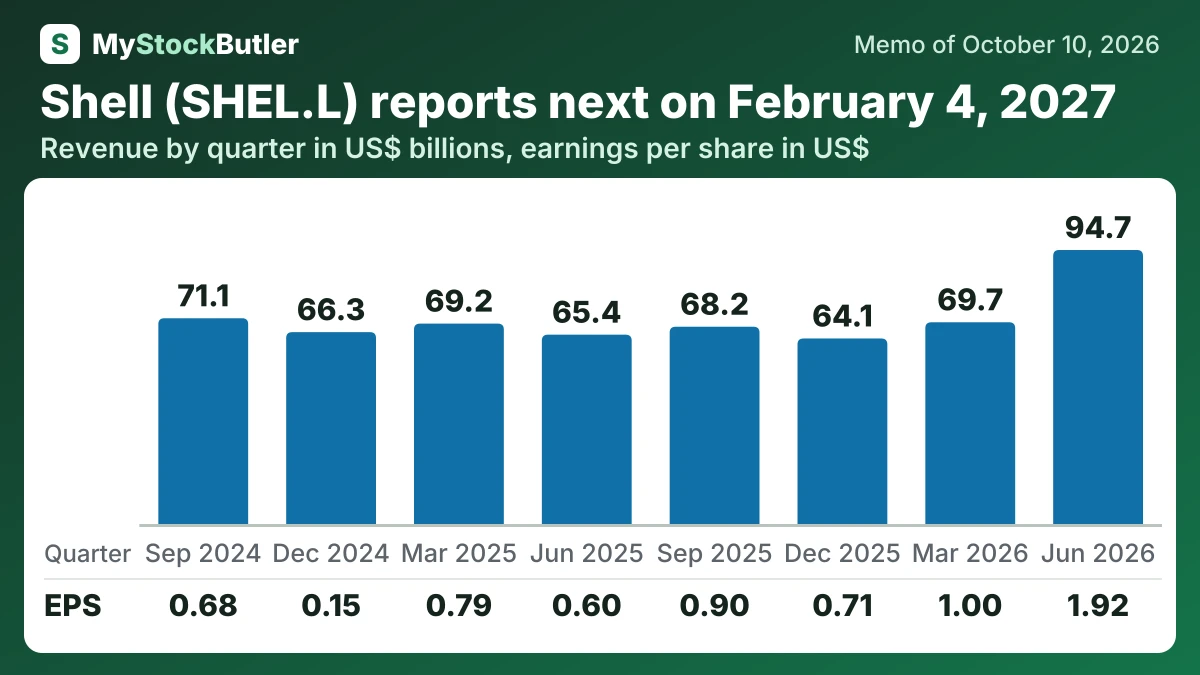
Shell’s reported profit improved, but its underlying earning power weakened.
| Quarter to Jun 2026 | Quarter to Mar 2026 | Quarter to Dec 2025 | Quarter to Sep 2025 | Quarter to Jun 2025 | Quarter to Mar 2025 | Quarter to Dec 2024 | Quarter to Sep 2024 | |
|---|---|---|---|---|---|---|---|---|
| Revenue | 94,664 | 69,691 | 64,093 | 68,153 | 65,406 | 69,234 | 66,281 | 71,089 |
| Net income | 10,821 | 5,694 | 4,134 | 5,322 | 3,601 | 4,780 | 928 | 4,291 |
| EPS, diluted | 1.92 | 1.00 | 0.71 | 0.90 | 0.60 | 0.79 | 0.15 | 0.68 |
| Cash from operations | 21,432 | 6,062 | 9,438 | 12,207 | 11,937 | 9,281 | 13,162 | 14,684 |
| Capital spending | 4,031 | 3,757 | 5,250 | 4,557 | 5,393 | 3,748 | 6,486 | 4,690 |
What should you watch in Shell’s next results?
The next results will show whether ARC’s added production becomes dependable cash.