Pearson stock forecast 2027–2029
MyStockButler's October 2026 analysis: Pearson's weighted case is 1522.15 GBp in October 2027 and 1601.53 GBp in October 2029, with 13% and 23% returns including dividends. It hinges on durable earnings growth, contract performance and cash conversion.
Where could Pearson's shares be by 2029?
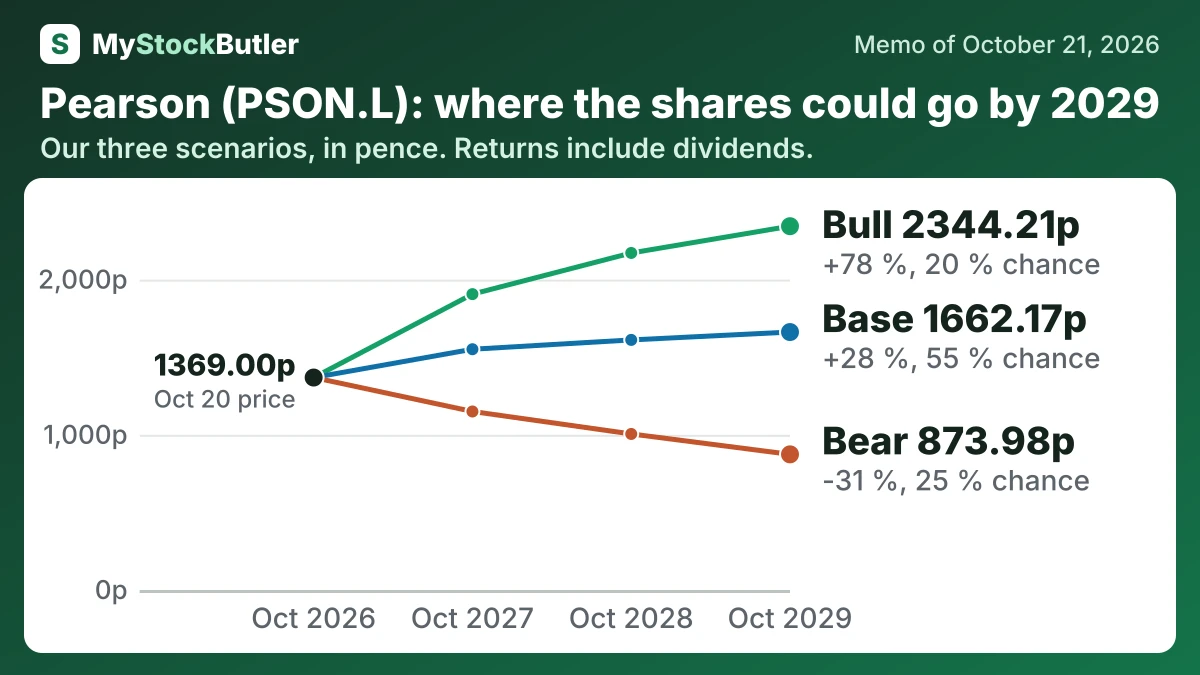
The weighted case puts the price at 1522.15 GBp in October 2027, a +13% return including dividends, and 1601.53 GBp in October 2029, a +23% return including dividends. Bear, base and bull probabilities are 25%, 55% and 20%.
| Case | Probability | October 2027 | October 2028 | October 2029 |
|---|---|---|---|---|
| Bear | 25 % | 1150.26 (-14 %) | 1005.47 (-23 %) | 873.98 (-31 %) |
| Base | 55 % | 1551.45 (+15 %) | 1611.44 (+22 %) | 1662.17 (+28 %) |
| Bull | 20 % | 1906.44 (+41 %) | 2171.70 (+63 %) | 2344.21 (+78 %) |
| Weighted | 100 % | 1522.15 (+13 %) | 1572.00 (+19 %) | 1601.53 (+23 %) |
What has to go right or wrong for Pearson?
The bear annual path starts at £420m in 2026 and falls to £405m in 2027. It stays at £405m in 2028 and recovers to £408m in 2029. The bull path starts at £444m in 2026 and rises to £496m in 2027. It reaches £551m in 2028 and £606m in 2029. The differences reflect New Jersey, testing delays, PTE weakness and Credly retention below 100%, versus Virtual Learning growth, Inclusive Access adoption and successful employer partnerships.
How much cash does Pearson really make?
Cash from operations was £656m in 2025. After capital spending and lease payments, analytical free cash flow was £550m. Subtracting share-based pay produces £511m of “real free cash flow”. That last measure treats employee shares as an economic cost because issuing them can dilute existing owners, even though it does not require the same cash payment today.
| 2025 | 2024 | 2023 | 2022 | 2021 | |
|---|---|---|---|---|---|
| Cash from operations | 656 | 627 | 525 | 361 | 326 |
| − Capital spending | 29 | 33 | 30 | 57 | 64 |
| − Lease payments | 77 | 78 | 84 | 93 | 88 |
| = Free cash flow | 550 | 516 | 411 | 211 | 174 |
| − Stock pay | 39 | 44 | 40 | 35 | 28 |
| = Real free cash flow | 511 | 472 | 371 | 176 | 146 |
What this means. The company's own free cash flow differs from ours because it uses different rules, adding back some cash costs and subtracting others.
What does an investor pay for Pearson today?
Earnings per share means profit allocated to each share. The price-to-earnings ratio, or P/E, says how much investors pay for each pound of that profit. Pearson’s 2025 basic EPS was 51.4p, while adjusted EPS was 64.5p. Basic earnings include the costs and gains required by accounting rules; adjusted earnings remove items Pearson considers unusual. That can clarify ordinary performance, but it can also remove costs that consumed real cash. Trailing P/E uses recent earnings, while forward P/E uses an estimate, so the lower forward figure matters only if the forecast is comparable and repeatable.
| Today (Oct 21, 2026) | |
|---|---|
| Share price | 1,369.00 |
| P/E, last 12 months (calculated) | 27.38x |
| P/E, next 12 months (calculated) | 19.35x |
| Free cash flow yield (calculated) | 6.7% |
| Real free cash flow yield (calculated) | 6.2% |
What this means. The next-twelve-month earnings figure uses analysts’ guesses about future profit, so it is not guaranteed.