UiPath earnings: guidance and next results
MyStockButler's October 2026 analysis: UiPath's next results are expected on December 2, 2026. Watch whether revenue and ARR turn into operating profit and cash.
What has UiPath guided for the year?
Revenue guidance is $1.789–$1.794 billion for the year to January 2027. ARR guidance is $2.065–$2.070 billion. Non-GAAP operating income guidance is $445 million. Adjusted free cash flow guidance is $425 million, and the FY2027 dilution ceiling is 0.0%.
| The period guided | Low | High | The date it was given | |
|---|---|---|---|---|
| Revenue | Year to Jan 2027 | 1,789,000 | 1,794,000 | 2026-09-03 |
| ARR | Year to Jan 2027 | 2,065,000 | 2,070,000 | 2026-09-03 |
| Non-GAAP operating income | Year to Jan 2027 | 445,000 | 445,000 | 2026-09-03 |
| non-GAAP adjusted free cash flow | Year to Jan 2027 | 425,000 | 425,000 | 2026-09-03 |
| Dilution for FY 2027 | Year to Jan 2027 | 0.0% | 2026-09-03 |
Did UiPath keep its past promises?
Management’s promises also require the right comparison. Its initial public guidance for fiscal 2026 revenue was US$1.525 billion–US$1.530 billion, while reported revenue reached US$1.6106 billion. Revenue therefore exceeded that forecast, even though the internal growth target used for bonuses was not fully met. A favorable result against one promise does not prove success against another.
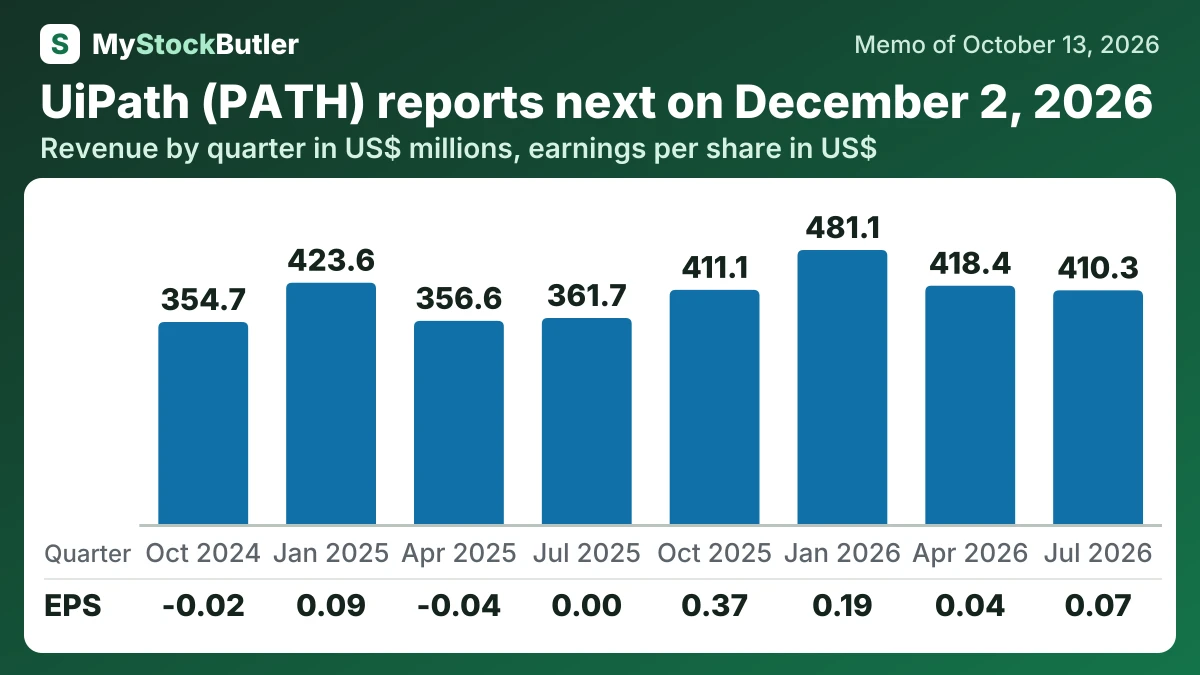
What have UiPath's last eight quarters shown?
Revenue was 410,256, up from 361,728 in July 2025. GAAP operating income was 31,604, versus -20,185 a year earlier. This was the fourth consecutive quarter of GAAP operating profitability, which is stronger evidence than a single favorable contract-timing result.
Delivery economics were less encouraging. Gross margin fell to 80.4% from 82.2%. Stock compensation was about 45 million, while adjusted operating income was approximately 89 million. The gap shows why continuing GAAP improvement is the stricter test.
| Jul 2026 | Apr 2026 | Jan 2026 | Oct 2025 | Jul 2025 | Apr 2025 | Jan 2025 | Oct 2024 | |
|---|---|---|---|---|---|---|---|---|
| Revenue | 410,256 | 418,382 | 481,107 | 411,113 | 361,728 | 356,624 | 423,646 | 354,653 |
| Gross margin | 80.4% | 81.6% | 84.6% | 83.3% | 82.2% | 82.1% | 84.8% | 82.0% |
| Operating income | 31,604 | 27,987 | 80,286 | 13,071 | -20,185 | -16,412 | 33,609 | -43,364 |
| Net income | 36,089 | 22,525 | 104,462 | 198,839 | 1,584 | -22,555 | 51,794 | -10,655 |
| EPS, diluted | 0.07 | 0.04 | 0.19 | 0.37 | 0.00 | -0.04 | 0.09 | -0.02 |
| = Free cash flow | 29,310 | 129,244 | 179,296 | 25,107 | 41,587 | 106,170 | 138,690 | 23,195 |
What should I watch in UiPath's next results?
UiPath’s investor-relations calendar lists no upcoming event. The market’s provisional estimate is December 2, 2026 for the third-quarter report, but UiPath has not confirmed it. Investors should compare revenue and ARR with guidance, then examine operating profit and cash collection. ARR matters only if customers renew and expand, and if those contracts eventually produce earnings and cash.