UiPath stock forecast 2027–2029
MyStockButler's October 2026 analysis: The weighted case for UiPath is $8.57 in October 2027, with the bear case at 30%, the base case at 55%, and the bull case at 15%. It hinges on better cash conversion, customer expansion and paid AI adoption.
Where could UiPath's shares be in October 2027?
Weighted value is $8.57 in October 2027. That is a -38% return. The October 2029 weighted value is $12.32. That is a -10% return versus $13.72 today. The bear case has 30% probability; the base case has 55%. The bull case has 15%.
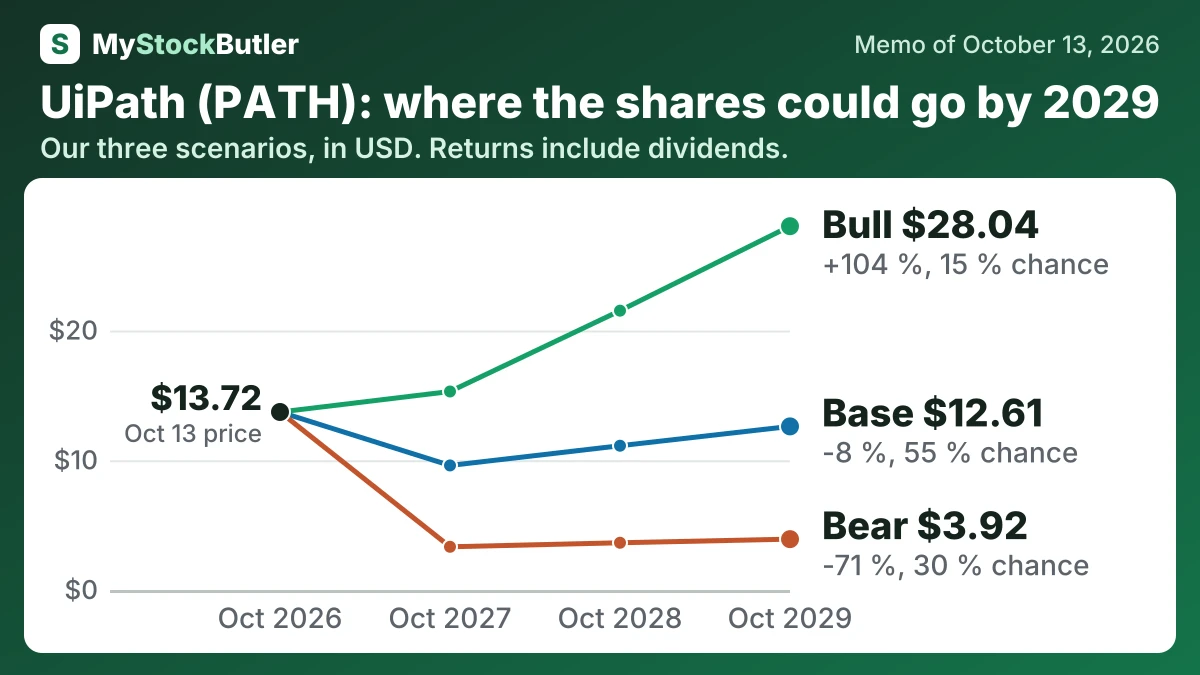
| Case | Probability | October 2027 | October 2028 | October 2029 |
|---|---|---|---|---|
| Bear | 30 % | 3.33 (-76 %) | 3.64 (-74 %) | 3.92 (-71 %) |
| Base | 55 % | 9.60 (-30 %) | 11.12 (-19 %) | 12.61 (-8 %) |
| Bull | 15 % | 15.30 (+12 %) | 21.53 (+57 %) | 28.04 (+104 %) |
| Weighted | 100 % | 8.57 (-38 %) | 10.44 (-24 %) | 12.32 (-10 %) |
What has to go right for UiPath's stock forecast?
This is slower than the bull case, which produces $207.9 million initially and $450.5 million by the final date. It requires paid agents, stronger renewals and better delivery economics. The bear case falls to $37.2 million before recovering to $79.2 million, because weak expansion, services costs, stock pay and working-capital swings overwhelm modest revenue growth.
How much cash does UiPath really make?
Operating cash flow was 371,208 in FY26. Capital spending was 19,048, leaving free cash flow of 352,160. The business needs little physical investment to add customers, but it still requires engineers, support staff, and hosting.
Stock pay was 290,676, leaving 61,484 under the memo’s “real free cash flow” measure. This is not a GAAP figure: issuing shares does not spend the same cash amount. It does, however, transfer part of the business to employees, so cash generation looks much thinner after including that cost.
| Jan 2026 | Jan 2025 | Jan 2024 | Jan 2023 | Jan 2022 | |
|---|---|---|---|---|---|
| Cash from operations | 371,208 | 320,565 | 299,082 | -9,981 | -54,963 |
| − Capital spending | 19,048 | 14,923 | 7,342 | 23,815 | 13,060 |
| = Free cash flow | 352,160 | 305,642 | 291,740 | -33,796 | -68,023 |
| − Stock pay | 290,676 | 358,151 | 371,955 | 369,840 | 515,583 |
| = Real free cash flow | 61,484 | -52,509 | -80,215 | -403,636 | -583,606 |
What does an investor pay for UiPath today?
The P/E ratio tells investors how many dollars they pay for each dollar of profit. UiPath’s trailing P/E is 20.5x, while its forward P/E is 17.4x. But net income includes interest earned on cash, and a $204.9 million release of a tax valuation allowance reduced reported tax expense without representing new software sales.
| Today (Oct 13, 2026) | |
|---|---|
| Share price | 13.725 |
| P/E, last 12 months (calculated) | 20.5x |
| P/E, next 12 months (calculated) | 17.4x |
| EV / revenue, last 12 months (calculated) | 3.4x |
| Free cash flow yield (calculated) | 4.9% |
| Real free cash flow yield (calculated) | 0.9% |