Otis stock forecast 2027–2029
MyStockButler's October 2026 analysis: Otis's weighted price reaches $75.73 by October 2027 and $93.62 by October 2029. It hinges on whether Otis can make its service pivot durable, profitable cash flow.
Where could Otis's shares be by 2029?
The forecast points to modest weighted upside, with dividends included. The weighted price is $75.73 by October 2027, a 6% total return. It reaches $83.98 by October 2028, a 20% return. By October 2029, it reaches $93.62, a 36% return.
The 2029 range runs from $49.46 to $147.06. Today's price is $72.87. The bear case carries 30%; the base case carries 52%. The bull case carries 18%. The weighting therefore favors gradual improvement, but leaves substantial room for execution failure or a stronger service recovery.
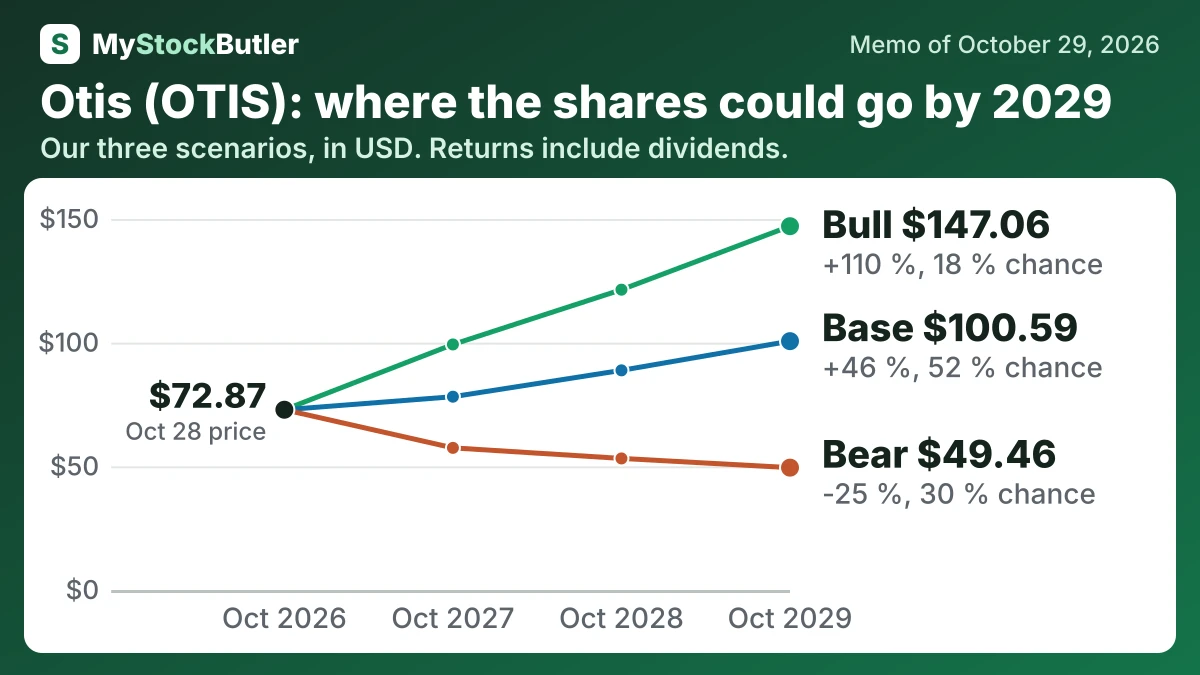
| Case | Probability | October 2027 | October 2028 | October 2029 |
|---|---|---|---|---|
| Bear | 30 % | 57.45 (-19 %) | 53.18 (-22 %) | 49.46 (-25 %) |
| Base | 52 % | 78.14 (+10 %) | 88.79 (+27 %) | 100.59 (+46 %) |
| Bull | 18 % | 99.26 (+39 %) | 121.40 (+72 %) | 147.06 (+110 %) |
| Weighted | 100 % | 75.73 (+6 %) | 83.98 (+20 %) | 93.62 (+36 %) |
What has to go right or wrong for Otis?
The bear story is that China equipment weakness and customer churn prevent Service from replacing lost installation profit. Technician investment arrives before retention benefits, while debt limits buybacks and valuation contracts. The bear path reaches $57.45 by October 2027 and $49.46 by October 2029. Its probability is 30% because China revenue has already fallen substantially and Service margin is below the prior year.
The base case gains support if management delivers its guided Service growth while retention outside China moves toward 95% and modernization sales sustain profit. The bull case becomes more likely if technician productivity improves by October 2027, modernization backlog converts through October 2028, and sustained cash-flow growth supports larger buybacks and multiple expansion by October 2029.
How much cash does Otis really make?
Operating cash exceeded capital spending by a wide margin in 2025. Capital spending covers facilities and equipment, so the relatively modest requirement supports cash conversion. The free-cash-flow table shows how much cash remains after that investment and how it compares with the company’s own count.
| 2025 | 2024 | 2023 | 2022 | 2021 | |
|---|---|---|---|---|---|
| Cash from operations | 1,596 | 1,563 | 1,627 | 1,560 | 1,750 |
| − Capital spending | 152 | 126 | 138 | 115 | 156 |
| = Free cash flow | 1,444 | 1,437 | 1,489 | 1,445 | 1,594 |
| − Stock pay | 80 | 73 | 64 | 67 | 65 |
| = Real free cash flow | 1,364 | 1,364 | 1,425 | 1,378 | 1,529 |
What this means. Otis's own free cash flow matches our count, but our real free cash flow is lower because shares given to employees are a real cost to shareholders even though no cash leaves the company.
What does an investor pay for Otis today?
| Today (Oct 29, 2026) | |
|---|---|
| Share price | 72.87 |
| P/E, last 12 months (calculated) | 18.1x |
| P/E, next 12 months (calculated) | 16.1x |
| EV / revenue, last 12 months (calculated) | 2.3x |
| Price to book (calculated) | not meaningful |
| Real free cash flow yield (calculated) | 4.9% |
What this means. The price-to-book number is not meaningful because the company owes more than it owns on paper.