MTY dividend: payment and cash coverage
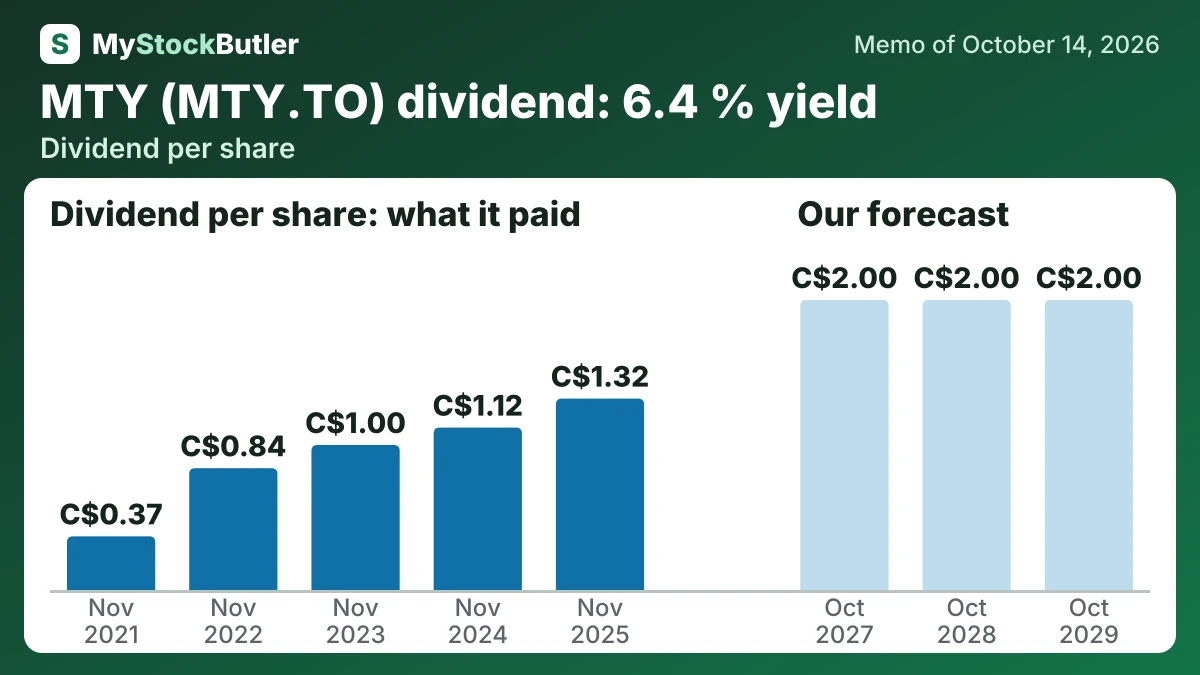
MyStockButler's October 2026 analysis: MTY paid C$1.32 per share in FY2025 and announced C$0.50 quarterly, or C$2 annually if maintained. Free cash flow supported dividends and buybacks while MTY also reduced net debt.
How much does MTY pay in dividends over time?
Q4 FY2026 is the first catalyst: 27 planned openings slipped from Q3 because of permits and pre-opening inspections. In the six to nine months after the October 9, 2026 guidance, completed exits, settled leases and recurring savings are the test. By the November 25, 2028 debt maturity, franchisee health and cash generation must support refinancing without sacrificing investment. FY2025 dividends were C$1.32 per share and buybacks C$1.21 per share, competing with debt needs.
The announced quarterly dividend is C$0.50, or C$2 annually if maintained. Its durability therefore depends on cash left after supporting brands, meeting leases and servicing debt. The first test is whether today’s cheapness survives comparison with MTY’s own past.
| Nov 2025 | Nov 2024 | Nov 2023 | Nov 2022 | Nov 2021 | |
|---|---|---|---|---|---|
| EPS, diluted | 5.18 | 1.01 | 4.25 | 3.06 | 3.46 |
| − Dividends paid, per share | 1.32 | 1.12 | 1.00 | 0.84 | 0.37 |
| − Share buybacks, per share | 1.21 | 1.74 | 0.17 | 0.60 | 0.09 |
What this means. The company's own free cash flow per share is higher than our real free cash flow per share because it includes money from selling assets, while our figure also subtracts the value of shares given to employees as pay.
Does MTY's cash cover its dividend?
By FY2025, acquisitions had stopped. Free cash flow supported dividends and buybacks, while MTY also reduced net debt. A dividend pays shareholders directly; a buyback uses company cash to purchase the company’s own shares. Both return money to owners, but both compete with debt reduction and future investment.
Free cash flow starts with cash from operations and subtracts capital spending and lease payments. Stock compensation is not a cash payment in the year recorded, but treating it as an economic cost gives a stricter measure of what shareholders received.
| Nov 2025 | Nov 2024 | Nov 2023 | Nov 2022 | Nov 2021 | |
|---|---|---|---|---|---|
| Free cash flow | 122,943 | 133,266 | 108,778 | 116,863 | 117,182 |
| − Dividends paid | 30,302 | 26,811 | 24,407 | 20,518 | 9,141 |
| − Share buybacks | 27,740 | 41,815 | 4,167 | 14,618 | 2,184 |
| = Free cash flow not paid out | 64,805 | 64,310 | 80,021 | 81,324 | 105,857 |
| Paid out, % of free cash flow | 47.2% | 51.5% | 26.3% | 30.1% | 9.7% |
What could change MTY's dividend?
The base dividend is C$2.00 per share in each window because MTY has declared C$0.50 quarterly. The bear case keeps that rate until the maturity period, then cuts the final window to C$1.625. The bull case raises annual dividends to C$2.20 and then C$2.40, requiring stronger cash generation.
| October 2027 | October 2028 | October 2029 | |
|---|---|---|---|
| Earnings | 94.40 (74.50 / 105) | 99.60 (61.80 / 115) | 106 (63.90 / 124) |
| Shares (millions) | 22.59 (22.84 / 22.08) | 22.43 (22.84 / 21.41) | 22.19 (22.84 / 20.81) |
| Dividends per share | 2.00 (2.00 / 2.00) | 2.00 (2.00 / 2.20) | 2.00 (1.62 / 2.40) |
| Price to earnings | 7.50 (5.50 / 9.50) | 8.00 (4.50 / 11.00) | 8.50 (4.50 / 12.00) |