MTY stock forecast 2027–2029
MyStockButler's October 2026 analysis: MTY's weighted share price is C$29.80 in October 2027. It hinges on franchisee health, not acquisition scale, carrying MTY through refinancing.
Where could MTY's shares be by 2029?
The weighted share price is C$29.80 in October 2027, a +1% total return. It is C$37.82 in October 2029, a +39% total return. The bear case has 30% probability. The base case has 52%. The bull case has 18%.
The forecast puts the probability-weighted share price at C$29.80 in October 2027, including dividends for a 1% return from today’s C$31.41. It rises to C$32.77 in October 2028, a 17% total return, and C$37.82 in October 2029, a 39% total return.
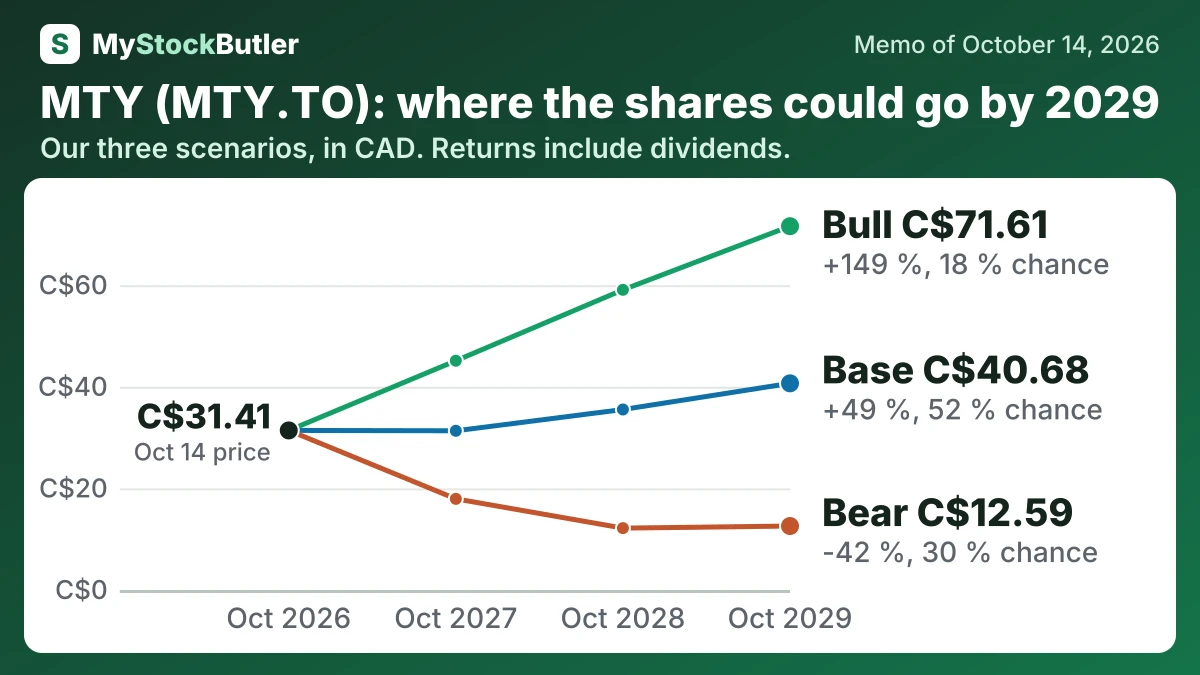
| Case | Probability | October 2027 | October 2028 | October 2029 |
|---|---|---|---|---|
| Bear | 30 % | 17.94 (-37 %) | 12.18 (-49 %) | 12.59 (-42 %) |
| Base | 52 % | 31.34 (+6 %) | 35.53 (+26 %) | 40.68 (+49 %) |
| Bull | 18 % | 45.13 (+50 %) | 59.09 (+101 %) | 71.61 (+149 %) |
| Weighted | 100 % | 29.80 (+1 %) | 32.77 (+17 %) | 37.82 (+39 %) |
What has to go right, and what could go wrong for MTY?
The base case assumes revenue of C$1,110 million and a normalized net margin of 8.5%, producing C$94.4 million of earnings. It then assumes C$1,145 million of revenue and C$99.6 million of earnings. The final window reaches C$106 million on C$1,180 million of revenue and a 9.0% margin. These assumptions reflect gradual stabilization, store exits and an orderly refinancing, without acquisitions or one-time gains. The first earnings figure also sits near the analyst EPS cross-check of C$4.16167.
The bear case gives C$74.5 million initially, then C$61.8 million, as revenue falls from C$1,080 million to C$1,030 million and margins weaken. It assumes traffic pressure, franchisee stress and refinancing costs. The bull case reaches C$104.9 million initially and C$115 million thereafter, finishing at C$124 million. It requires traffic recovery, delayed openings and a stronger royalty mix.
| October 2027 | October 2028 | October 2029 | |
|---|---|---|---|
| Earnings | 94.40 (74.50 / 105) | 99.60 (61.80 / 115) | 106 (63.90 / 124) |
| Shares (millions) | 22.59 (22.84 / 22.08) | 22.43 (22.84 / 21.41) | 22.19 (22.84 / 20.81) |
| Dividends per share | 2.00 (2.00 / 2.00) | 2.00 (2.00 / 2.20) | 2.00 (1.62 / 2.40) |
| Price to earnings | 7.50 (5.50 / 9.50) | 8.00 (4.50 / 11.00) | 8.50 (4.50 / 12.00) |
How much cash does MTY really make?
Free cash flow starts with cash from operations and subtracts capital spending and lease payments. Stock compensation is not a cash payment in the year recorded, but treating it as an economic cost gives a stricter measure of what shareholders received.
| Nov 2025 | Nov 2024 | Nov 2023 | Nov 2022 | Nov 2021 | |
|---|---|---|---|---|---|
| Cash from operations | 184,151 | 204,807 | 184,586 | 148,481 | 139,299 |
| − Capital spending | 15,544 | 27,726 | 32,169 | 12,658 | 6,763 |
| − Lease payments | 45,664 | 43,815 | 43,639 | 18,960 | 15,354 |
| = Free cash flow | 122,943 | 133,266 | 108,778 | 116,863 | 117,182 |
| − Stock pay | 417 | 646 | 792 | 1,002 | 836 |
| = Real free cash flow | 122,526 | 132,620 | 107,986 | 115,861 | 116,346 |
What this means. The company's own free cash flow is higher because it counts money from selling assets and, in older years, leaves out lease payments that are cash leaving the business.