Metlen stock forecast 2027–2029
MyStockButler's October 2026 analysis: The weighted scenario is €46.44 in October 2027 and €67.18 in October 2029. It hinges on whether Metlen turns project execution and industrial growth into cash, then directs that cash to debt reduction.
Where could Metlen's shares be by October 2029?
The forecast’s central outcome is a modest gain at first, followed by stronger returns as earnings recover and debt falls. The probability-weighted price is €46.44 in October 2027, for a 2% return including dividends from today’s €46.94. It rises to €55.09 in October 2028, a 25% return, and €67.18 in October 2029, a 55% return.
The 2029 outcomes range from €10.47 in the bear case to €147.37 in the bull case. The forecast assigns 25% to the bear case, 55% to the base case and 20% to the bull case.
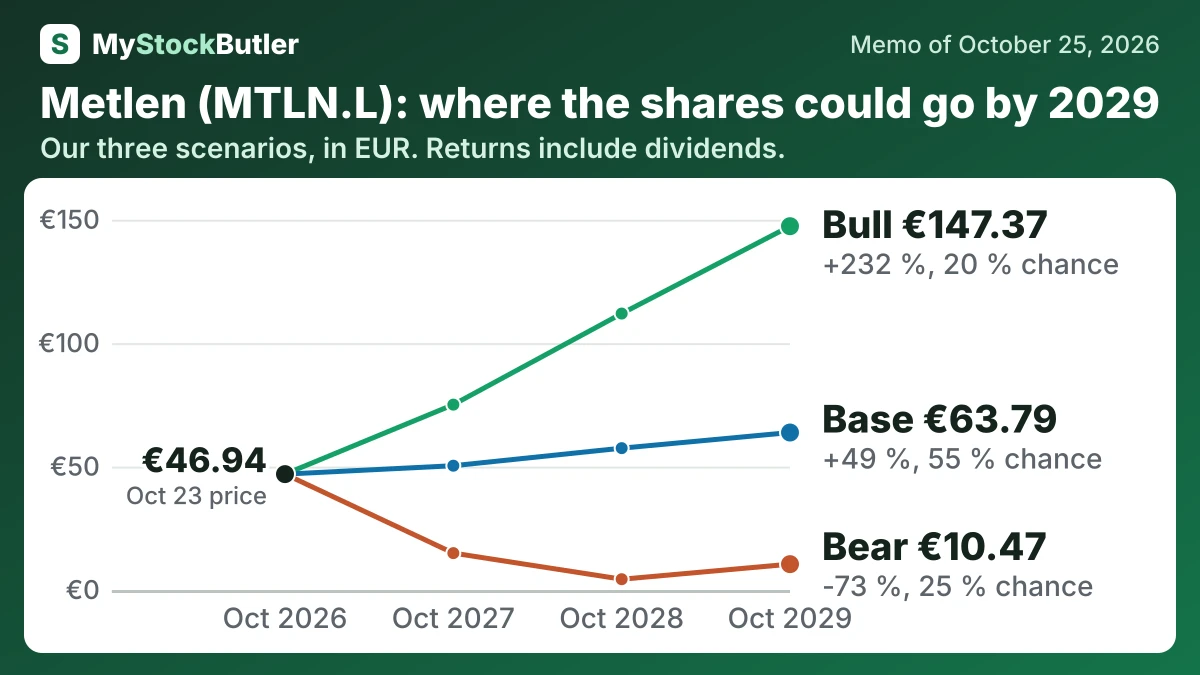
| Case | Probability | October 2027 | October 2028 | October 2029 |
|---|---|---|---|---|
| Bear | 25 % | 14.94 (-67 %) | 4.37 (-88 %) | 10.47 (-73 %) |
| Base | 55 % | 50.35 (+11 %) | 57.46 (+31 %) | 63.79 (+49 %) |
| Bull | 20 % | 75.09 (+65 %) | 111.98 (+149 %) | 147.37 (+232 %) |
| Weighted | 100 % | 46.44 (+2 %) | 55.09 (+25 %) | 67.18 (+55 %) |
What has to go right for Metlen's forecast, and what could go wrong?
Operating profit is the main earnings assumption. The base case uses €900m in October 2027 and €1,000m in October 2028. It reaches €1,100m in October 2029. The bear case falls to €700m, then €600m, before recovering to €700m. The bull case rises from €1,050m to €1,300m and then €1,500m. The base starts near management’s reaffirmed 2026 EBITDA guidance of €1.0–1.15bn, less roughly €200m of annual depreciation, while the bear reflects further EPC provisions and the bull assumes better aluminium economics, asset rotations and commercial gallium.
How much cash does Metlen really make?
Cash from operations was €445.9 million in 2025, but capital spending absorbed €627.7 million. Lease payments of €17.1 million left displayed free cash flow at negative €199.0 million. Deducting €17.7 million of stock compensation gives real free cash flow of negative €216.7 million.
| 2025 | 2024 | 2023 | 2022 | 2021 | |
|---|---|---|---|---|---|
| Cash from operations | 445,876 | 409,045 | 156,029 | 888,654 | 219,965 |
| − Capital spending | 627,706 | 643,688 | 875,725 | 686,818 | 365,147 |
| − Lease payments | 17,149 | 10,821 | 10,875 | 8,588 | 8,772 |
| = Free cash flow | -198,979 | -245,464 | -730,571 | 193,248 | -153,954 |
| = Real free cash flow | -216,709 | -257,117 | -747,241 | 167,868 | -157,954 |
What this means. The company's own free cash flow is lower because it subtracts extra spending on maintaining, growing, and improving the business that our count does not subtract.
What does an investor pay for Metlen today?
P/E, or price-to-earnings, shows what investors pay for each euro of shareholder profit. The trailing P/E is 18.1x. The forward P/E is 8.9x, which implies that earnings must recover sharply. Profit fell from €615 million in 2024 to €314 million in 2025, while reported net debt rose from €2.63 billion to €3.11 billion. The cheap-looking forward multiple therefore depends on both recovery and debt control.
| Today (Oct 25, 2026) | |
|---|---|
| Share price | 46.94 |
| Market value (calculated) | 6,674.669 |
| Enterprise value (calculated) | 9,295.866 |
| P/E, last 12 months (calculated) | 18.1x |
| P/E, next 12 months (calculated) | 8.9x |
| Price to book (calculated) | 2.1x |
What this means. The negative free cash flow yield means the company used more cash than it generated in the latest year, even if it reported a profit.