Southwest Airlines earnings
MyStockButler's October 2026 analysis: Southwest Airlines' next results are expected on January 27, 2027. The key thing to watch is whether recurring cash from flights can pay for fleet commitments.
What has Southwest Airlines guided for the year?
Southwest’s weighted forecast points below today’s price, hinging on whether commercial gains become recurring operating profit and cash after fleet investment. Management guides to adjusted EPS of $2.60–$2.85. Fourth-quarter RASM—revenue per available seat-mile, or revenue earned for each seat flown one mile—is expected to grow 19.0%–21.0%. CASM-X—operating cost per seat-mile excluding fuel and certain other costs—is expected to grow 4.0%–4.5%.
For 2027, management set a 10.0% operating margin and 15.0% after-tax return on invested capital. It also targeted $1,000 million of free cash flow. A new framework is due at Capital Markets Day, the company event where management presents plans and targets to investors.
| Period guided | Low | High | Date given | |
|---|---|---|---|---|
| Adjusted EPS | 4Q 2026 | 0.55 | 0.80 | Oct 21, 2026 |
| ASMs (a), year-over-year | 4Q 2026 | 3.0% | 4.0% | Oct 21, 2026 |
| RASM (b), year-over-year | 4Q 2026 | 19.0% | 21.0% | Oct 21, 2026 |
| CASM-X (c), year-over-year | 4Q 2026 | 4.0% | 4.5% | Oct 21, 2026 |
| Annual Operating margins | 2027 | 10.0% | Feb 7, 2025 | |
| Free cash flow | 2027 | 1,000 | Feb 7, 2025 |
What this means. The 2027 targets are older goals the company has not repeated recently, so they may no longer be current promises.
Has Southwest Airlines kept its past promises?
Management’s record is mixed. It met some original RASM forecasts, while nonfuel cost guidance was generally dependable and fuel estimates moved in both directions. It also cut guidance after weaker demand, operational disruption and fuel pressure. The guidance table shows the promises by period, range and date.
| What management forecast | Checked | Above | Within | Below |
|---|---|---|---|---|
| RASM, year-over-year | 8 quarters | 1 | 4 | 3 |
| CASM-X, year-over-year | 7 quarters | 0 | 3 | 4 |
| Fuel cost per gallon / Economic fuel costs per gallon | 8 quarters | 4 | 1 | 3 |
What is Southwest Airlines' recent revenue and profit trend?
Adjustments can point in opposite directions. In 2023, reported operating income was $224 million, while the company’s adjusted operating income was $893 million after removing selected compensation, disruption, and settlement items. In 2024, the company’s complete special-item measure produced adjusted operating income of $457 million. In 2025, it produced $539 million. Reported profit improved in 2025, but adjusted EPS fell from $0.96 in 2024 to $0.93 in 2025.
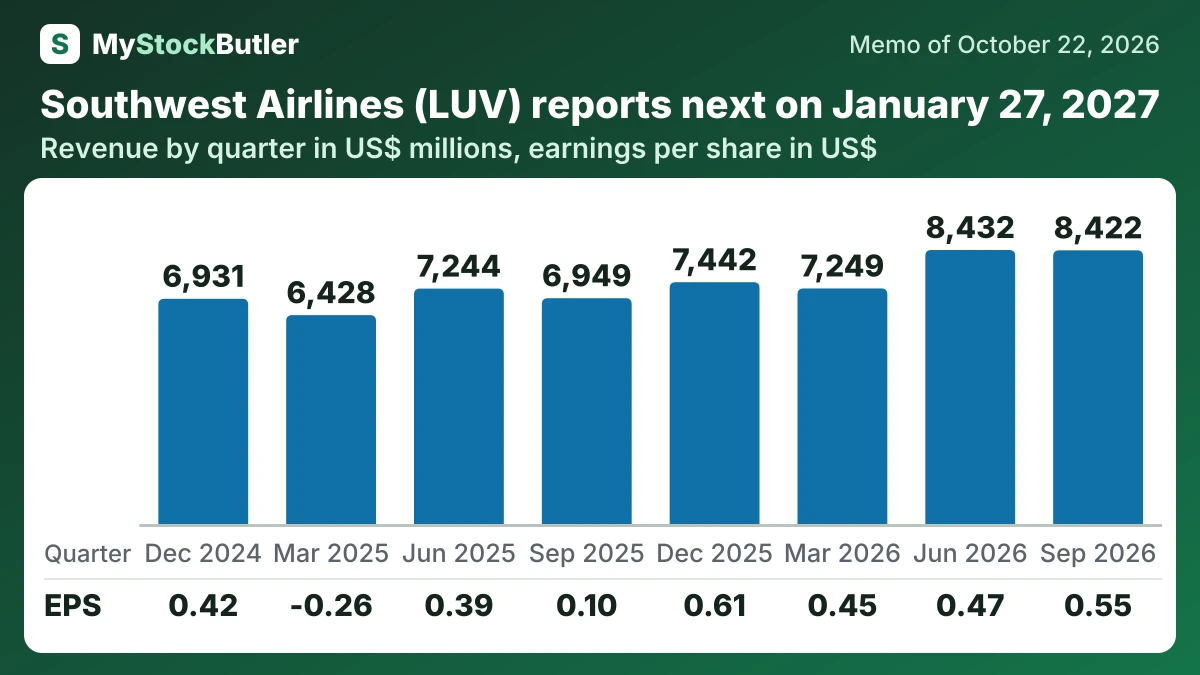
Revenue rose 21.2% from the September 2025 quarter to $8,422 million. Capacity declined 0.4%, while RASM rose 21.6%. That is stronger revenue production than Southwest showed in the 2025 annual comparison. Operating income rose to $379 million from $35 million.
| Sep 2026 | Jun 2026 | Mar 2026 | Dec 2025 | Sep 2025 | Jun 2025 | Mar 2025 | Dec 2024 | |
|---|---|---|---|---|---|---|---|---|
| Revenue | 8,422 | 8,432 | 7,249 | 7,442 | 6,949 | 7,244 | 6,428 | 6,931 |
| Operating income | 379 | 285 | 330 | 391 | 35 | 225 | -223 | 278 |
| Net income | 270 | 233 | 227 | 323 | 54 | 213 | -149 | 261 |
| EPS, diluted | 0.55 | 0.47 | 0.45 | 0.61 | 0.10 | 0.39 | -0.26 | 0.42 |
| Cash from operations | 513 | 530 | 1,418 | 295 | 287 | 401 | 860 | 476 |
| = Free cash flow | -208 | -30 | 980 | -564 | -391 | -234 | 359 | 15 |
What this means. Free cash flow can be negative even when the company brings in cash because buying equipment costs more than its daily business generates.