Hasbro dividend
MyStockButler's October 2026 analysis: Hasbro pays $2.80 per share annually at the current $0.70 quarterly rate. Hasbro generated $829.9 million of free cash flow in 2025 and paid $392.5 million in dividends.
How much does Hasbro pay per share?
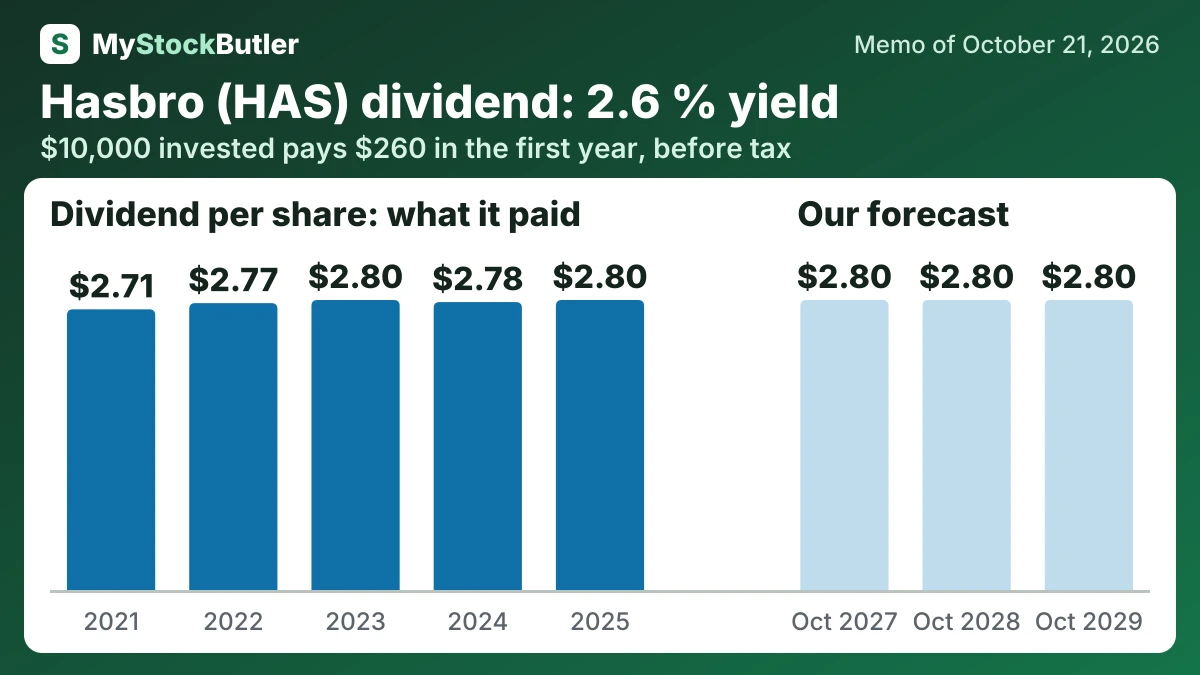
The final forecast holds dividends at $2.80 per share in every case. That equals the current $0.70 quarterly rate if maintained. Positive cash generation supports stability, but the absence of formal dividend-growth guidance argues against building increases into the table.
| 2025 | 2024 | 2023 | 2022 | 2021 | |
|---|---|---|---|---|---|
| EPS, diluted | -2.30 | 2.75 | -10.73 | 1.46 | 3.10 |
| Real free cash flow per share | 5.35 | 5.06 | 3.73 | 1.16 | 4.24 |
| − Dividends paid, per share | 2.80 | 2.78 | 2.80 | 2.77 | 2.71 |
| − Share buybacks, per share | 0.00 | 0.00 | 0.00 | 0.90 | 0.00 |
How much would Hasbro's dividend pay you?
$10,000 invested in Hasbro at its 2.6% dividend yield (our report of October 21, 2026) pays $260.00 in the first year, before tax. If its dividend per share keeps changing 0.8% a year, as it did from 2021 to 2025, and the dividends are reinvested, year 10 pays $355.25, with $3,050.36 received in all.
Before tax. Past dividend growth is not a promise. Information only, not investment advice.
Does Hasbro's cash cover its dividend?
The next three years were more disciplined. Free cash flow recovered to $590.1 million in 2023 and $760.2 million in 2024, then reached $829.9 million in 2025. Hasbro made no buybacks or acquisitions during 2023–2025. Dividends were $392.5 million in 2025, leaving $432.8 million after dividends and payments to minority owners.
Operating cash flow was $893.2 million in 2025. After $63.3 million of property and equipment spending, free cash flow was $829.9 million. That cash generation remained strong despite the reported net loss because the goodwill impairment reduced accounting profit without reducing cash.
| 2025 | 2024 | 2023 | 2022 | 2021 | |
|---|---|---|---|---|---|
| Free cash flow | 829.9 | 760.2 | 590.1 | 244.7 | 685.2 |
| − Dividends paid | 392.5 | 389.9 | 388.0 | 385.3 | 374.5 |
| − Share buybacks | 0 | 0 | 0 | 125.0 | 0 |
| = Free cash flow not paid out | 432.8 | 363.8 | 196.6 | 300.8 | |
| Paid to shareholders | 392.5 | 389.9 | 388.0 | 510.3 | 374.5 |
| Paid out, % of free cash flow | 47.3% | 51.3% | 65.8% | 208.5% | 54.7% |
What this means. In 2022, the company paid shareholders more cash than its business generated, so it had to use savings or borrow money to cover the difference.
What could change Hasbro's dividend?
Management guides to 7–9% constant-currency revenue growth and a 27–28% adjusted operating margin for 2026. The plan includes $400 million of share repurchases and $150 million of gross cost savings before reinvestment and other costs. The toy forecast has repeatedly fallen short.
| October 2027 | October 2028 | October 2029 | |
|---|---|---|---|
| Net asset value | 1,218 (967 / 1,318) | 1,698 (897 / 1,998) | 2,178 (827 / 2,678) |
| Shares (millions) | 137 (138 / 136) | 137 (139 / 134) | 136 (140 / 132) |
| Dividends per share | 2.80 (2.80 / 2.80) | 2.80 (2.80 / 2.80) | 2.80 (2.80 / 2.80) |
| Price to net asset value | 12.00 (8.00 / 16.00) | 11.00 (6.00 / 17.00) | 10.00 (5.00 / 18.00) |
What this means. Price to net asset value shows how many dollars investors pay for each dollar of what the company owns after debts.
What is Hasbro's dividend yield today?
Cash measures complete the picture. Free-cash-flow yield was 5.4%, while real free-cash-flow yield was 4.9%; the dividend yield was 2.6%. These are competing uses of the same cash, not returns to add together. Dividends and buybacks can reward shareholders, but debt repayment and future game investment also need funding.