Hasbro stock forecast 2027–2029
MyStockButler's October 2026 analysis: Hasbro's weighted price is $101.11 in October 2027, a 5% loss. It hinges on Wizards staying durable while toys and cash generation recover.
Where could Hasbro's shares be by 2029?
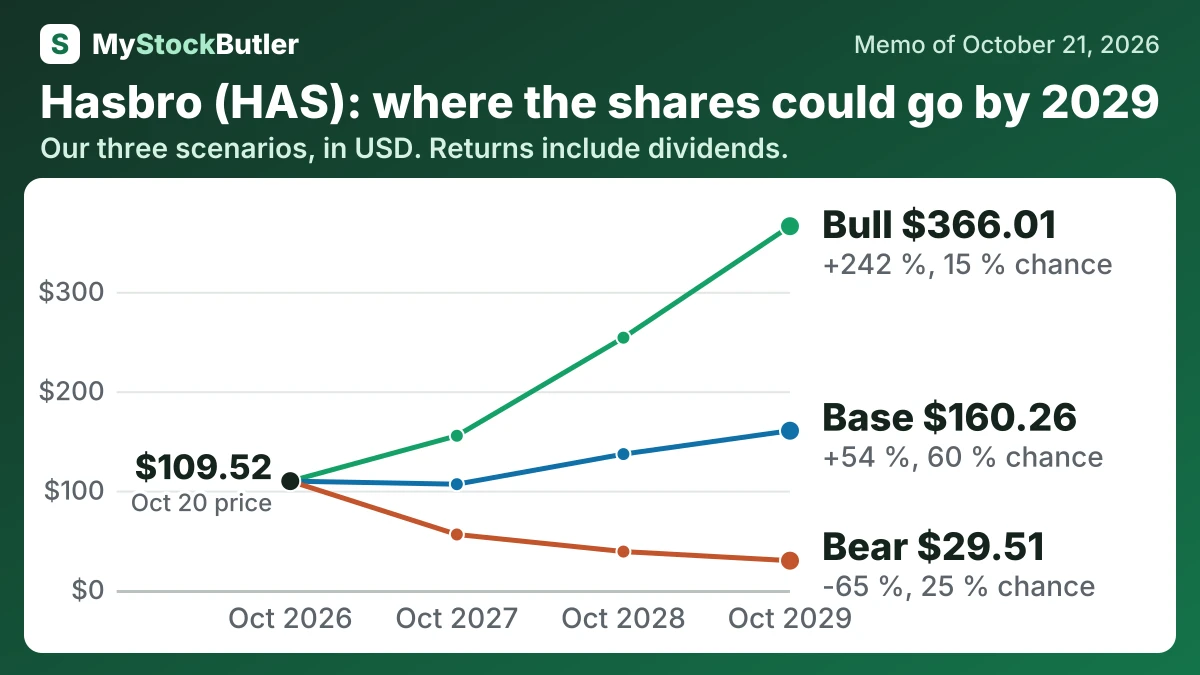
The weighted price is $101.11 in October 2027. That is a 5% loss. It reaches $158.44 in October 2029. That is a 52% gain. The bear case has 25% probability. The base case has 60%. The bull case has 15%.
| Case | Probability | October 2027 | October 2028 | October 2029 |
|---|---|---|---|---|
| Bear | 25 % | 55.86 (-46 %) | 38.64 (-60 %) | 29.51 (-65 %) |
| Base | 60 % | 106.45 (-0 %) | 136.73 (+30 %) | 160.26 (+54 %) |
| Bull | 15 % | 155.17 (+44 %) | 253.86 (+137 %) | 366.01 (+242 %) |
| Weighted | 100 % | 101.11 (-5 %) | 129.78 (+24 %) | 158.44 (+52 %) |
What this means. The weighted row is the average value after giving more weight to the cases that are more likely, not a separate forecast case.
What has to go right for Hasbro, and what could go wrong?
Q4 2026 and early 2027 will show whether MAGIC players keep buying after pulled-forward shipments and whether retailers reorder. Exodus launches April 7, 2027. Warlock is expected in the second half of 2027. Their lifetime cash returns must justify development and marketing spending. Through 2027–2029, Consumer Products reorders, game retention, post-launch cash returns, debt repayment, dividends and buybacks decide the outcome. Wizards must stay durable while toys and cash generation recover.
How much cash does Hasbro really make?
Operating cash flow was $893.2 million in 2025. After $63.3 million of property and equipment spending, free cash flow was $829.9 million. That cash generation remained strong despite the reported net loss because the goodwill impairment reduced accounting profit without reducing cash.
Software development is another investment bill. Hasbro spent $135.0 million on software in 2025. Including it reduces the analytical free-cash-flow figure to $694.9 million.
| 2025 | 2024 | 2023 | 2022 | 2021 | |
|---|---|---|---|---|---|
| Cash from operations | 893.2 | 847.4 | 725.6 | 372.9 | 817.9 |
| − Capital spending | 63.3 | 87.2 | 135.5 | 128.2 | 132.7 |
| = Free cash flow | 829.9 | 760.2 | 590.1 | 244.7 | 685.2 |
| − Stock pay | 80.4 | 50.8 | 72.4 | 83.4 | 97.8 |
| = Real free cash flow | 749.5 | 709.4 | 517.7 | 161.3 | 587.4 |
What this means. The company's own free cash flow is lower than ours in 2022 and 2021 because it subtracts extra cash items that we leave in.
What does an investor pay for Hasbro today?
The price-to-earnings ratio, or P/E, divides the share price by profit per share. It tells investors how much they pay for each dollar of earnings, but a low P/E is not automatically cheap. Imagine two shops priced alike: the one with the smaller profit has the higher P/E, but a one-time profit can make the lower ratio look deceptively attractive. Hasbro reported a loss in 2025, while adjusted earnings were $5.54 per diluted share after specified exclusions.
| Today (Oct 21, 2026) | |
|---|---|
| Share price | 109.52 |
| P/E, last 12 months (calculated) | 16.4x |
| Free cash flow yield (calculated) | 5.4% |
| Real free cash flow yield (calculated) | 4.9% |
| Dividend yield (calculated) | 2.6% |
What this means. The enterprise value is higher than the stock market value because the company has more debt than cash and short-term investments.