FedEx Freight stock forecast 2027–2029
MyStockButler's October 2026 analysis: The weighted scenario is $119.14 by October 2027 and $178.92 by October 2029. It hinges on shipment recovery.
Where could FedEx Freight's shares be by 2029?
The probability-weighted value reaches $119.14 by October 2027, compared with today’s $109.69. Including dividends, that is a 9% return. The weighted value rises to $146.09 by October 2028, a 34% return, and $178.92 by October 2029, a 65% return.
By October 2029, the bear case is $67.87 and the bull case is $334.34. The forecast assigns 30% to bear, 55% to base and 15% to bull because earnings recovery is plausible, but shipment weakness, debt and transition costs remain material risks.
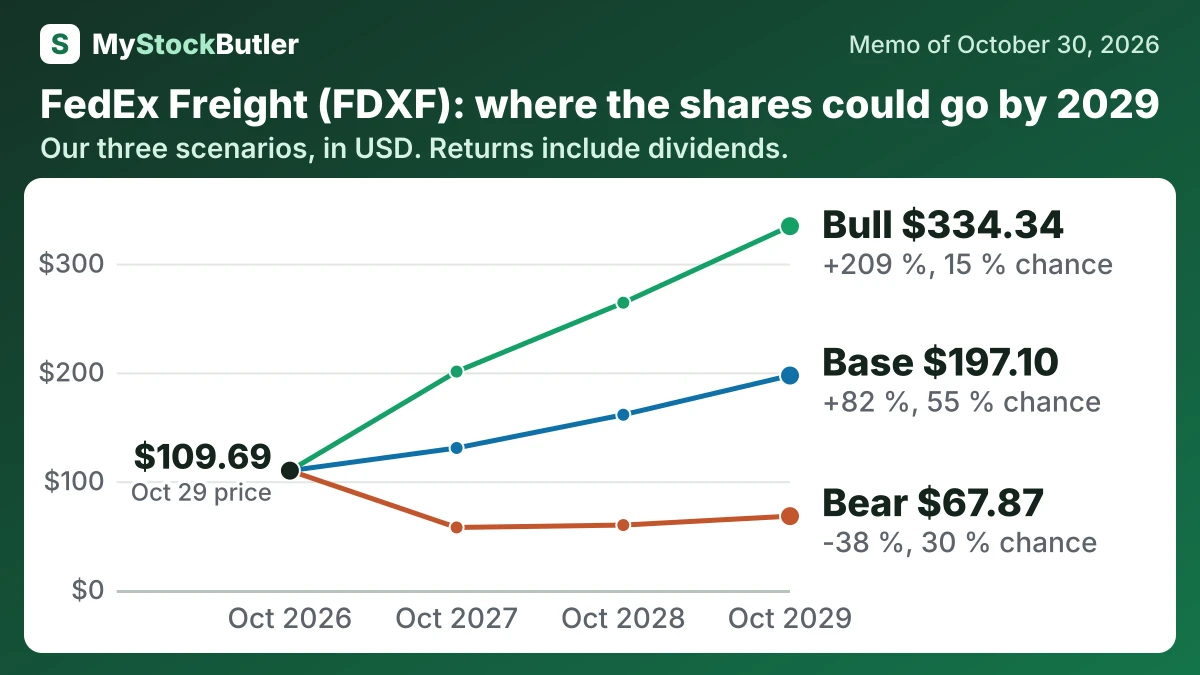
| Case | Probability | October 2027 | October 2028 | October 2029 |
|---|---|---|---|---|
| Bear | 30 % | 57.47 (-48 %) | 59.68 (-46 %) | 67.87 (-38 %) |
| Base | 55 % | 130.52 (+19 %) | 161.07 (+48 %) | 197.10 (+82 %) |
| Bull | 15 % | 200.73 (+84 %) | 264.01 (+143 %) | 334.34 (+209 %) |
| Weighted | 100 % | 119.14 (+9 %) | 146.09 (+34 %) | 178.92 (+65 %) |
What has to go right for FedEx Freight?
The base path rises from $1,254 million in the first window to $1,537 million in the last, with the intermediate value shown below. The bear path starts at $846 million and recovers slowly to $1,089 million. The bull path rises from $1,500 million to $1,955 million. The base assumes stabilizing freight, fading transition costs and gradual margin improvement. It remains below the stronger 2022–2025 average because shipments fell from 111,700 per day in May 2022 to 86,100 in May 2026.
The bull case requires a faster freight recovery, profitable repricing and stronger network density without service deterioration.
| October 2027 | October 2028 | October 2029 | |
|---|---|---|---|
| Normal operating profit | 1,254 (846 / 1,500) | 1,384 (960 / 1,728) | 1,537 (1,089 / 1,955) |
| Shares (millions) | 150 (150 / 150) | 150 (150 / 150) | 150 (150 / 150) |
| Dividends per share | 0.50 (0.00 / 1.00) | 0.75 (0.00 / 1.50) | 1.00 (0.00 / 2.00) |
| Enterprise value to normal operating profit | 18.00 (14.00 / 22.00) | 19.00 (12.00 / 24.00) | 20.00 (11.00 / 26.00) |
| Net debt | 2,991 (3,217 / 2,885) | 2,115 (2,550 / 1,887) | 1,130 (1,764 / 782) |
How much cash does FedEx Freight really make?
Cash flow collapsed because weaker earnings arrived alongside a major change in receivables. Operating cash flow fell to $167 million in the year ended May 2026 from $1.5 billion in the year ended May 2025. After $379 million of capital spending, free cash flow was negative $212 million; after stock-based pay, the stated “real free cash flow” was negative $225 million.
| May 2026 | May 2025 | May 2024 | May 2023 | May 2022 | |
|---|---|---|---|---|---|
| Cash from operations | 167 | 1,531 | 1,541 | 1,752 | |
| − Capital spending | 379 | 437 | 461 | 558 | 319 |
| = Free cash flow | -212 | 1,094 | 1,080 | 1,194 | |
| − Stock pay | 13 | 10 | 12 | 13 | |
| = Real free cash flow | -225 | 1,084 | 1,068 | 1,181 |
What this means. In May 2026, the business brought in 167 million dollars from operations but had 1,413 million dollars tied up in stock and unpaid customer bills, leaving negative cash after equipment spending and shares given to employees.