EMCOR dividend
MyStockButler's October 2026 analysis: EMCOR pays a $0.40 quarterly dividend after raising it from $0.25 to $0.40 in the first quarter of 2026. Free cash flow reached US$1,189,313 thousand in 2025, while cash also funded buybacks and other uses.
How much does EMCOR pay its shareholders over the years shown?
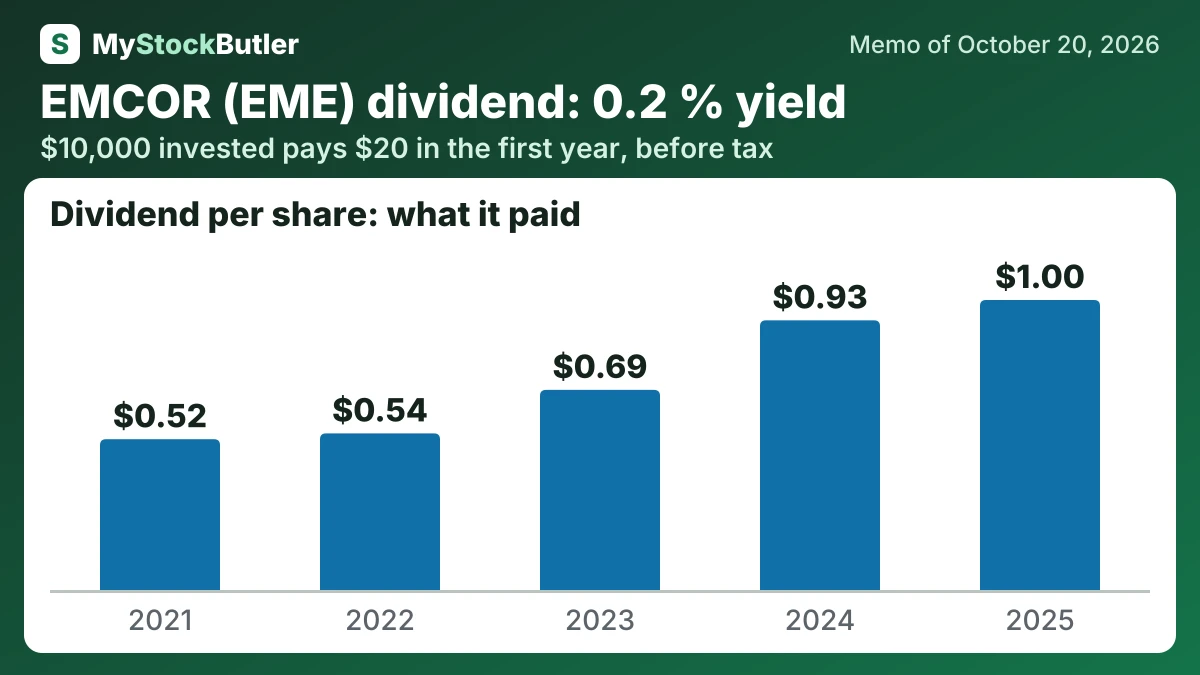
The board raised the quarterly dividend from $0.25 to $0.40 beginning in the first quarter of 2026 and added $500 million to its buyback authorization. The dividend is a recurring commitment; the authorization is permission, not a promise. EMCOR’s success is clear in its ability to fund several uses of cash. The harder question is which use earns the best return, and that depends on how well the acquired businesses operate.
| 2025 | 2024 | 2023 | 2022 | 2021 | |
|---|---|---|---|---|---|
| EPS, diluted | 28.19 | 21.52 | 13.31 | 8.10 | 7.06 |
| Real free cash flow per share | 25.89 | 28.05 | 16.98 | 8.71 | 5.00 |
| − Dividends paid, per share | 1.00 | 0.93 | 0.69 | 0.54 | 0.52 |
| − Share buybacks, per share | 12.99 | 10.46 | 2.69 | 13.18 | 3.60 |
| = FCF not paid out, per share | 12.34 | 17.09 | 13.89 | 1.08 |
What this means. Real free cash flow is lower because it subtracts the value of shares given to employees as pay.
How much would EMCOR's dividend pay you?
$10,000 invested in EMCOR at its 0.2% dividend yield (our report of October 20, 2026) pays $20.00 in the first year, before tax. If its dividend per share keeps changing 17.8% a year, as it did from 2021 to 2025, and the dividends are reinvested, year 10 pays $90.45, with $474.53 received in all.
Before tax. Past dividend growth is not a promise. Information only, not investment advice.
Is EMCOR’s dividend covered by its cash?
Free cash flow was US$282,625 thousand in 2021. It reached US$1,189,313 thousand in 2025, although that was below the prior year’s level. Free cash flow already subtracts purchases of property and equipment, so EMCOR’s US$112,750 thousand of equipment spending in 2025 should not be subtracted again. That investment supported fabrication shops and digital construction tools intended to improve field productivity.
EMCOR returned money to shareholders mainly through buybacks. In 2022, repurchases were US$660,609 thousand, and total shareholder payouts reached 153.3% of that year’s free cash flow. In 2023, the payout ratio was only 19.5%. Buybacks reduce the number of shares dividing future earnings, but they create value only when EMCOR pays a sensible price.
| 2025 | 2024 | 2023 | 2022 | 2021 | |
|---|---|---|---|---|---|
| Free cash flow | 1,189,313 | 1,332,944 | 821,251 | 448,644 | 282,625 |
| − Dividends paid | 45,023 | 43,384 | 32,684 | 27,187 | 28,163 |
| − Share buybacks | 586,258 | 489,820 | 127,713 | 660,609 | 195,546 |
| = Free cash flow not paid out | 557,098 | 799,740 | 660,854 | 58,873 | |
| Paid out, % of free cash flow | 53.1% | 40.0% | 19.5% | 153.3% | 79.2% |
| Paid out, % of real free cash flow | 54.0% | 40.6% | 19.9% | 157.6% | 82.4% |
What this means. In 2022, the company paid shareholders more cash than it generated, so it had to use savings or borrow money to cover the difference.
What could change EMCOR’s dividend?
But an invoice is not cash until the customer pays. Retainage reached approximately $944.5 million, and EMCOR expected about 90% of it to be collected during 2026. The size and timing of that collection matter because withheld payments can depend on project acceptance, claims and disputed changes.
What is EMCOR’s dividend yield today?
| Today (Oct 20, 2026) | |
|---|---|
| Share price | 702.75 |
| Market value (calculated) | 30,998,233 |
| P/E, last 12 months (calculated) | 21.9x |
| Free cash flow yield (calculated) | 3.8% |
| Real free cash flow yield (calculated) | 3.8% |
| Dividend yield (calculated) | 0.2% |
What this means. The next-12-month price-to-earnings ratio uses analysts’ expected profit, so it is only an estimate and can be wrong.