Cooper earnings
MyStockButler's October 2026 analysis: Cooper's next results are expected on December 3, 2026. Watch whether lens orders recover as inventory normalizes.
What has Cooper guided for FY2026?
Management guides CooperVision organic revenue growth of -2% to 0%. The guidance covers the quarter to October 2026. CooperSurgical is guided to 4% to 6%. FY2026 guidance calls for 2% to 3% organic revenue growth and $4.51–$4.55 non-GAAP diluted EPS. The FY2026–2028 free-cash-flow objective exceeds $2,200.0 million. MiSight growth is expected at 20.0% in FY2026.
| The period guided | Low | High | The date it was given | |
|---|---|---|---|---|
| total revenue (Year to Oct 2026) | Year to Oct 2026 | 4,229.0 | 4,252.0 | Sep 9, 2026 |
| total revenue, organic growth (%) (Year to Oct 2026) | Year to Oct 2026 | 2.0% | 3.0% | Sep 9, 2026 |
| non-GAAP diluted EPS (Year to Oct 2026) | Year to Oct 2026 | 4.51 | 4.55 | Sep 9, 2026 |
| long-term free cash flow objective (Fiscal 2026 through 2028) | Fiscal 2026 through 2028 | 2,200.0 | Sep 9, 2026 | |
| MiSight growth (%) (Year to Oct 2026) | Year to Oct 2026 | 20.0% | 20.0% | Sep 9, 2026 |
What this means. The long-term free cash flow objective is a minimum of more than 2.2 billion United States dollars, not a range with a missing upper limit.
Has Cooper kept its past promises?
Guidance is another test. Cooper’s March 2026 presentation projected adjusted annual earnings of US$4.58–US$4.66 per share; its September forecast was US$4.51–US$4.55. Management also reaffirmed a free-cash-flow objective exceeding $2.2 billion for fiscal 2026–2028. Guidance is a forecast, while free cash flow is delivered cash, so the objective remains unproved. JANA’s call for revised compensation metrics reflects that gap: shareholders want rewards tied not only to forecasts, but to cash and returns.
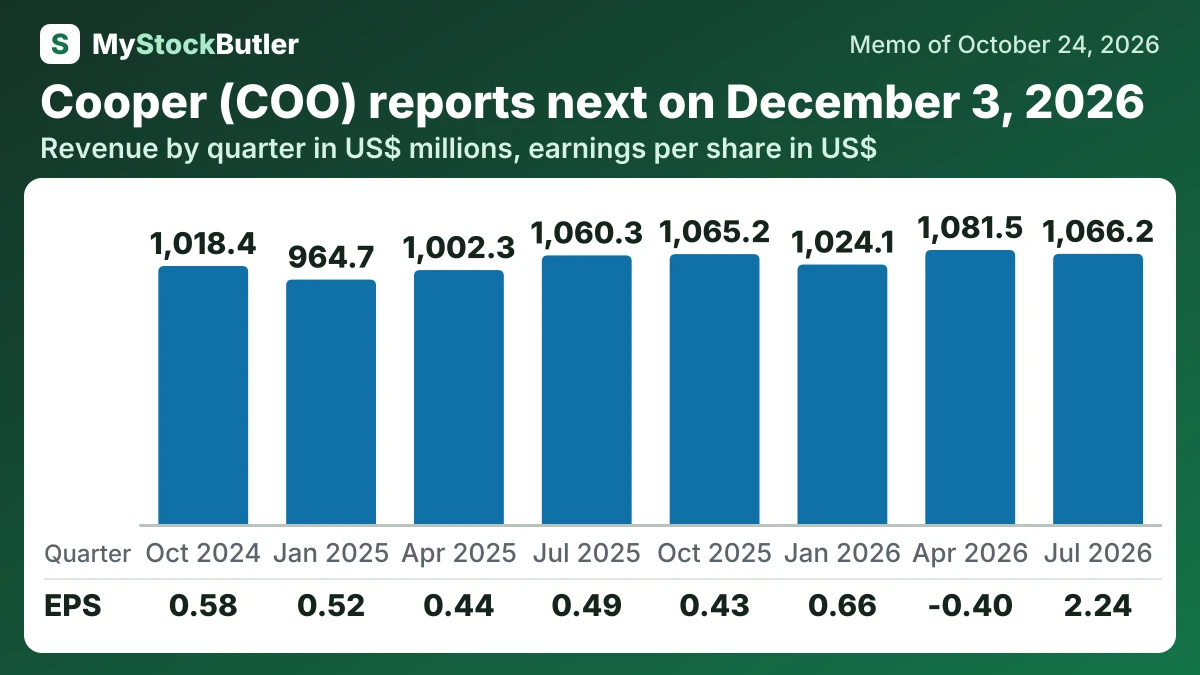
What do Cooper's last eight quarters show?
| Jul 2026 | Apr 2026 | Jan 2026 | Oct 2025 | Jul 2025 | Apr 2025 | Jan 2025 | Oct 2024 | |
|---|---|---|---|---|---|---|---|---|
| Revenue | 1,066.2 | 1,081.5 | 1,024.1 | 1,065.2 | 1,060.3 | 1,002.3 | 964.7 | 1,018.4 |
| Gross margin | 66.8% | 68.0% | 67.9% | 61.1% | 65.3% | 67.8% | 68.4% | 66.5% |
| Operating income | 222.0 | -31.0 | 212.8 | 140.4 | 175.7 | 184.8 | 182.0 | 198.4 |
| Net income | 432.8 | -77.9 | 130.8 | 84.6 | 98.3 | 87.7 | 104.3 | 117.5 |
| EPS, diluted | 2.24 | -0.40 | 0.66 | 0.43 | 0.49 | 0.44 | 0.52 | 0.58 |
| = Free cash flow | 273.0 | 96.4 | 158.7 | 149.9 | 164.5 | 18.1 | 101.2 | 128.1 |
What this means. Net income in July 2026 is unusually high because the company recorded a one-time tax benefit of 307.2 million dollars.
What should you watch in Cooper's next results?
The practical takeaway is demanding but clear: Cooper must turn its product investment into lens growth while funding legal obligations and debt without weakening execution.